Thousands of work orders, one plan a team can move.
Maintenance planners on oil and gas sites juggle hundreds of activities across rigs, teams and years, each one with a cost in lost production. Cognite sold them a set of tools. We turned the plan itself into the workspace. It started as a side concept I made with Dan Levings, and I led the design from that concept to the live app.
Given: Cognite’s brand and Cogs, the company design system. On top of it we built Maintain’s own component library.

The live app, Dec 2022: activities grouped by work centre, a weekly Gantt coloured by category.
Cognite already sold a set of tools for planners: 3D, a Gantt, a P&ID viewer. Users could not tell what it was for: “a visualisation tool? Or maybe a scheduling tool?”
Started a new concept with Dan, then led design as it became a product: one plan with several views, suggestions a planner approves, and the features field teams asked for.
A live product built on one decision: the plan is the workspace, and the Gantt, the network map and the table are views of it.
The plan, on the plant.
3D was planned for the next version of Maintain. I left Cognite before it was built. This concept puts it on top of the interface we shipped: the 90-day plan sits on a model of the platform, work orders are pinned to their equipment, and the timeline below moves the plant through the plan. When two jobs collide in one place, the zone lights up, and a planner can suggest a fix to the plan owner. The plan data and the platform model are made up for the concept. Try it below.
A side concept that turned into a team.
Dan Levings and I worked together on Cognite’s design system. I was collecting research with the data department: interviews, competitor benchmarks, other complex interfaces. Dan came with an idea: let’s build the tool our own internal users keep asking for, at first for the data scientists. We made the concept between projects and showed it inside the company. It landed, and a team was formed around it.
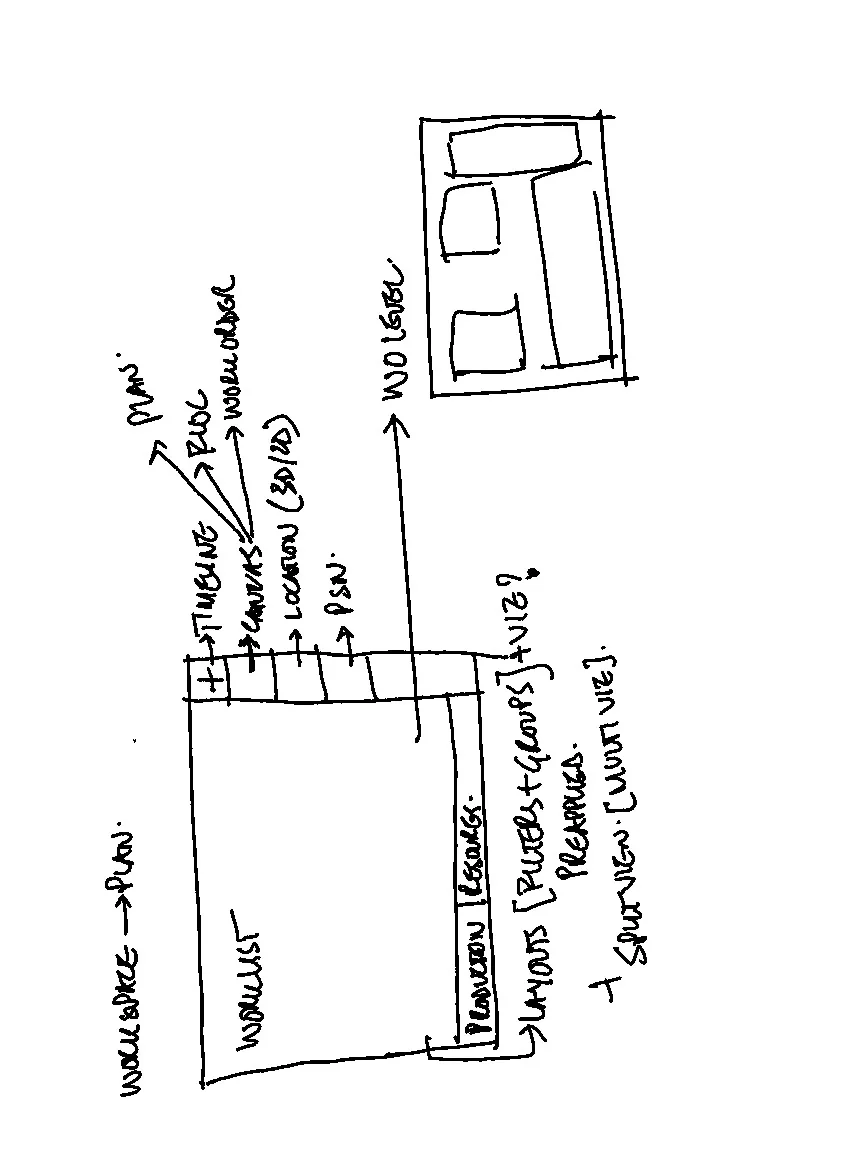
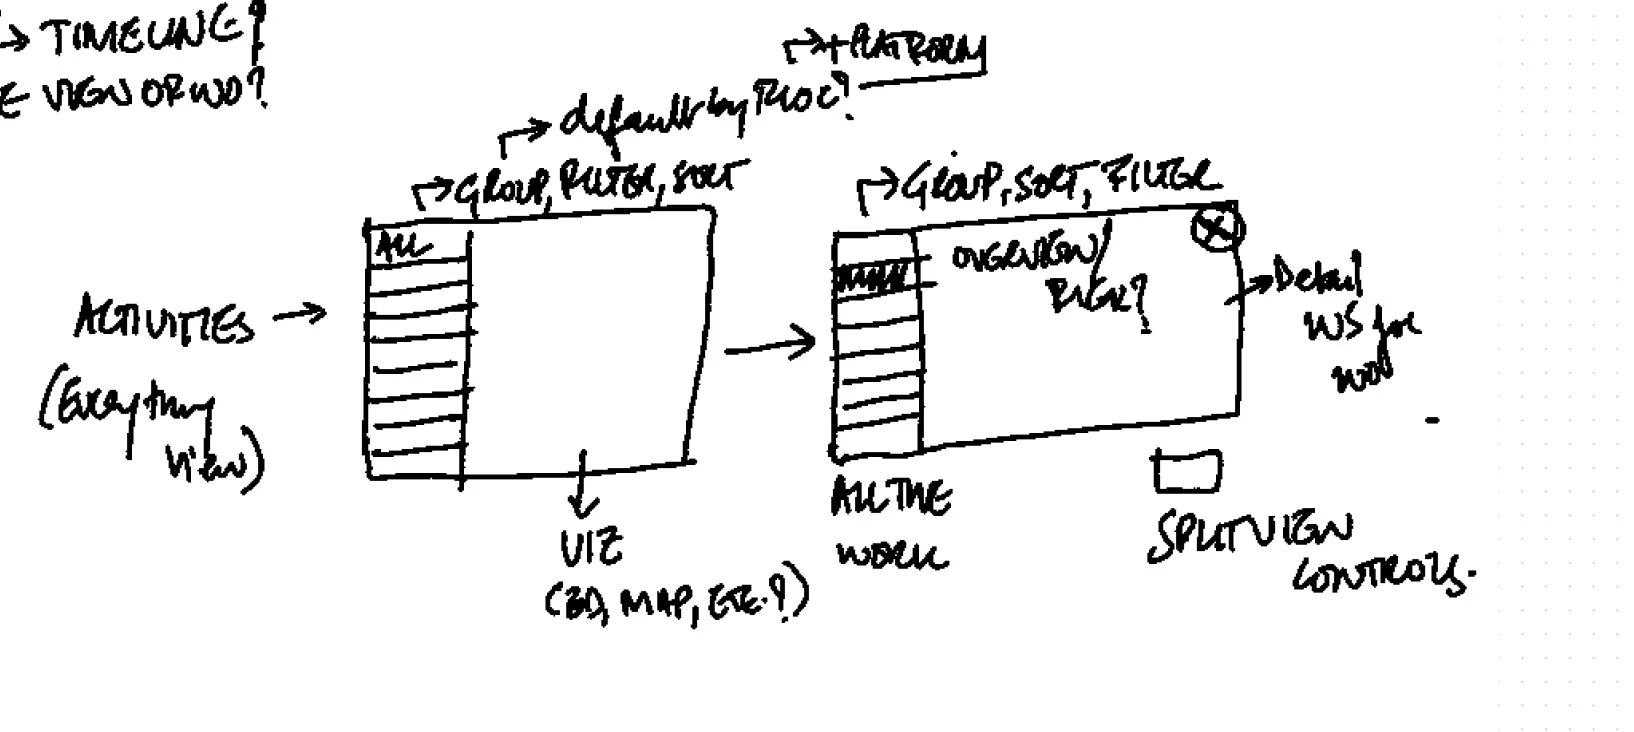
Concept sketches, Jan 2022 · a plan as the workspace, the list on the left, any view on the right.
- Sumit Pandey, leadLed the team, with a long track record in the industry. Owned the customer research and relationships.
- Me, lead designerUX, UI and the component library across every area: plans, Gantt, network map, optimisations and the field features.
- Meg Ong, designerDesigned features with me, from plan sharing to sub-activities.
The Figma files often carry one name on a feature. We still designed one product together, in the same workshops and reviews.
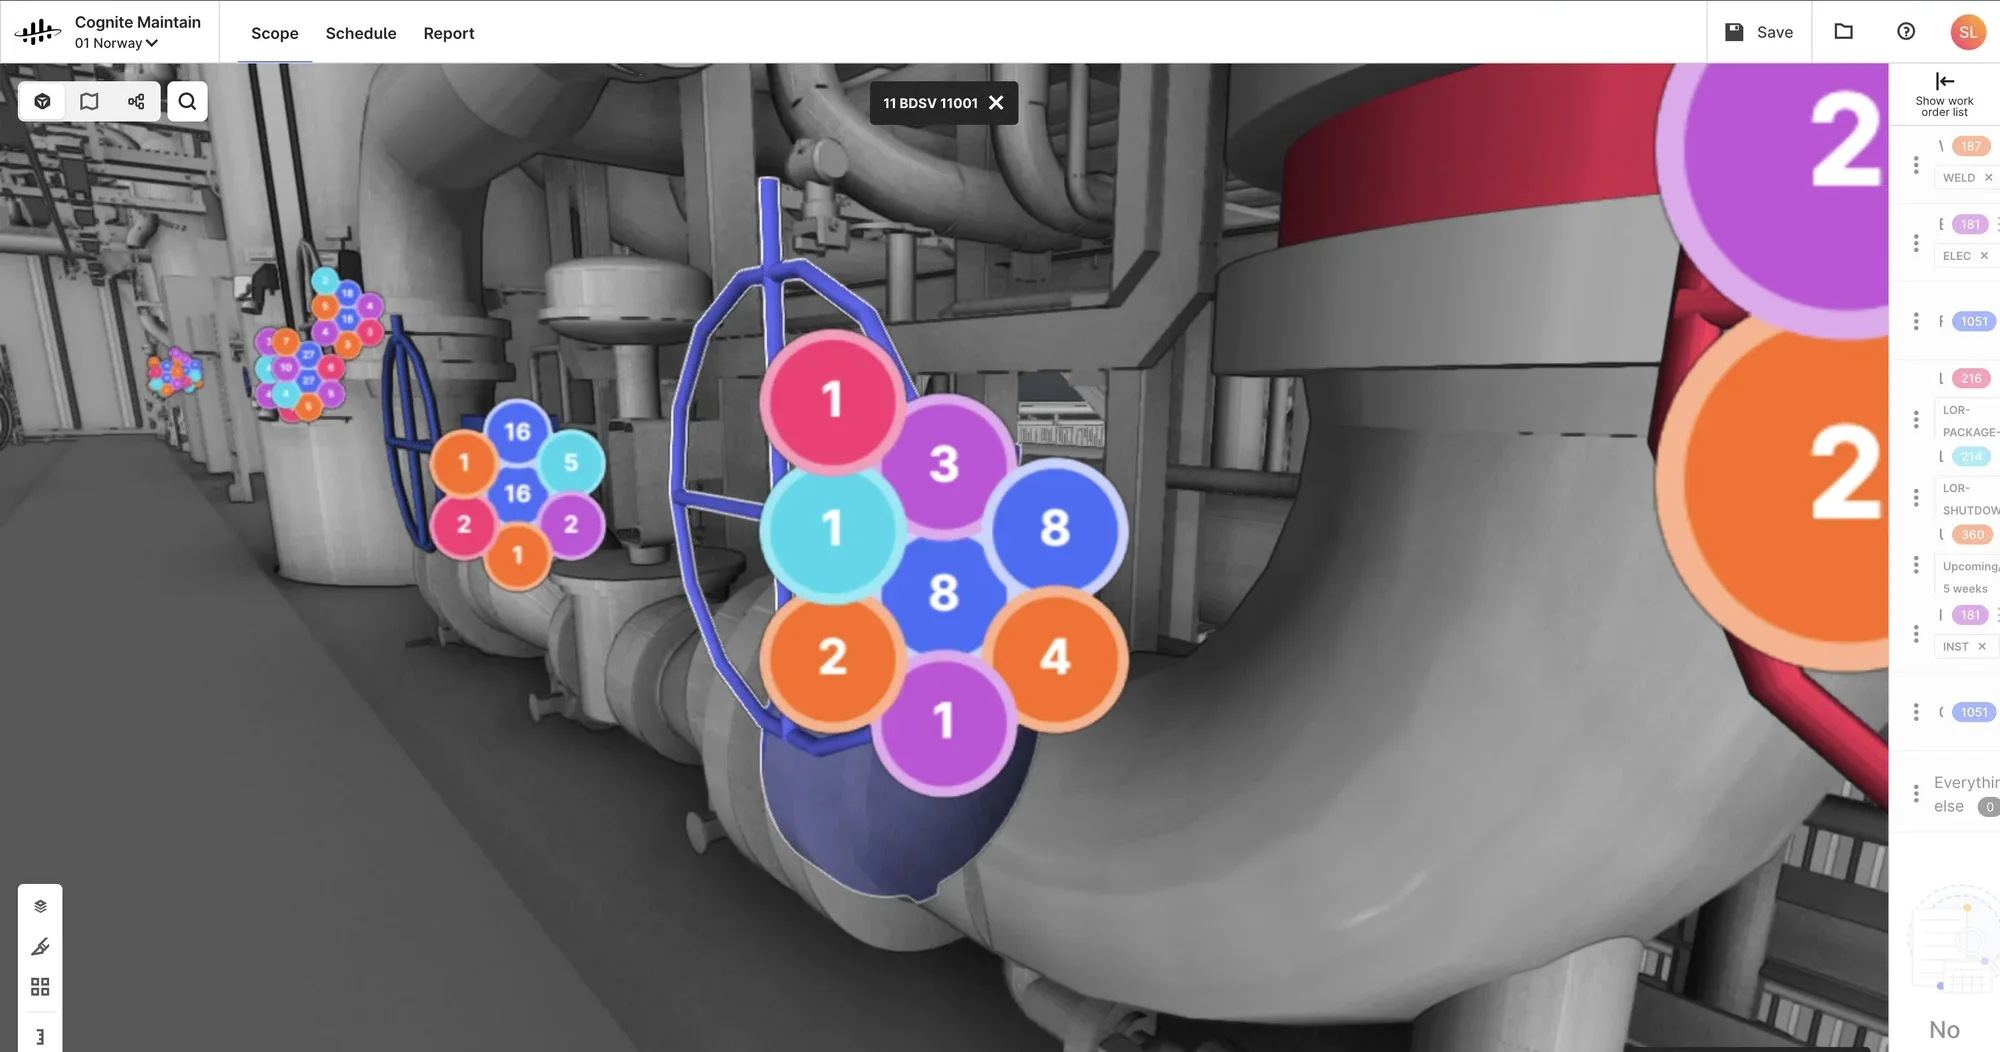
Before, Nov 2021 · the earlier tool’s 3D view, the one we audited first.
A set of tools, then one workspace.
The earlier product grew one customer request at a time: NOC, then OMV, then ExxonMobil. Each added a tool, and none of them followed how a planner works.
- “I can see all this in 3D, but I’m not sure why I would want to do it.”User, on the earlier tool
- Our audit of the 3D viewColours repeat and the legend is hidden. Numbers in circles under 48 px can’t be read. Humans don’t read in a circle. The hidden work-order list looks like a bug.
- The reframePlanners plan. Plans get prepped, shared, iterated on, optimised and executed. So the plan became the workspace, and 3D, Gantt, documents and the network became views of it.
Four planners, one plan they all argue over.
Planning lived in SAP, Primavera, Excel and email, and every planner saw only their own slice. We mapped who plans what, then went to the sites.
- Functional plannerOne discipline: maintenance, inspection, pipelines, rotating or static equipment. Picks work orders from the backlog within budget and schedules them around people, materials and timing.
- Integrated planner (IAP)Combines every functional plan into one, finds work and resource collisions, and proposes changes to the functional planners.
- Campaign / turnaround plannerPlans long campaigns and shutdowns one to two years out, and re-baselines when critical jobs slip.
- Operations supervisorOn the plant, not at HQ. Makes sure the plan is ready to execute: people, materials and stop-of-work conditions.
The integrated planning flow Maintain was built around, from the users cheat sheet and the IAP flow mapped with OMV.
Interviews role by role, from shutdown planners to engineering leads, with live demos and a synthesis per group. We learned to focus on three groups and to make Maintain the tool for isolation planning.
The IAP meeting runs largely in the tool itself. Layouts, direct planning and dependencies are critical, and the 2-year plan matters most to asset managers.
Is manufacturing different from oil and gas? Asset leaders hand-pick operations, and the plan needs a freeze, break-ins and a re-baseline.
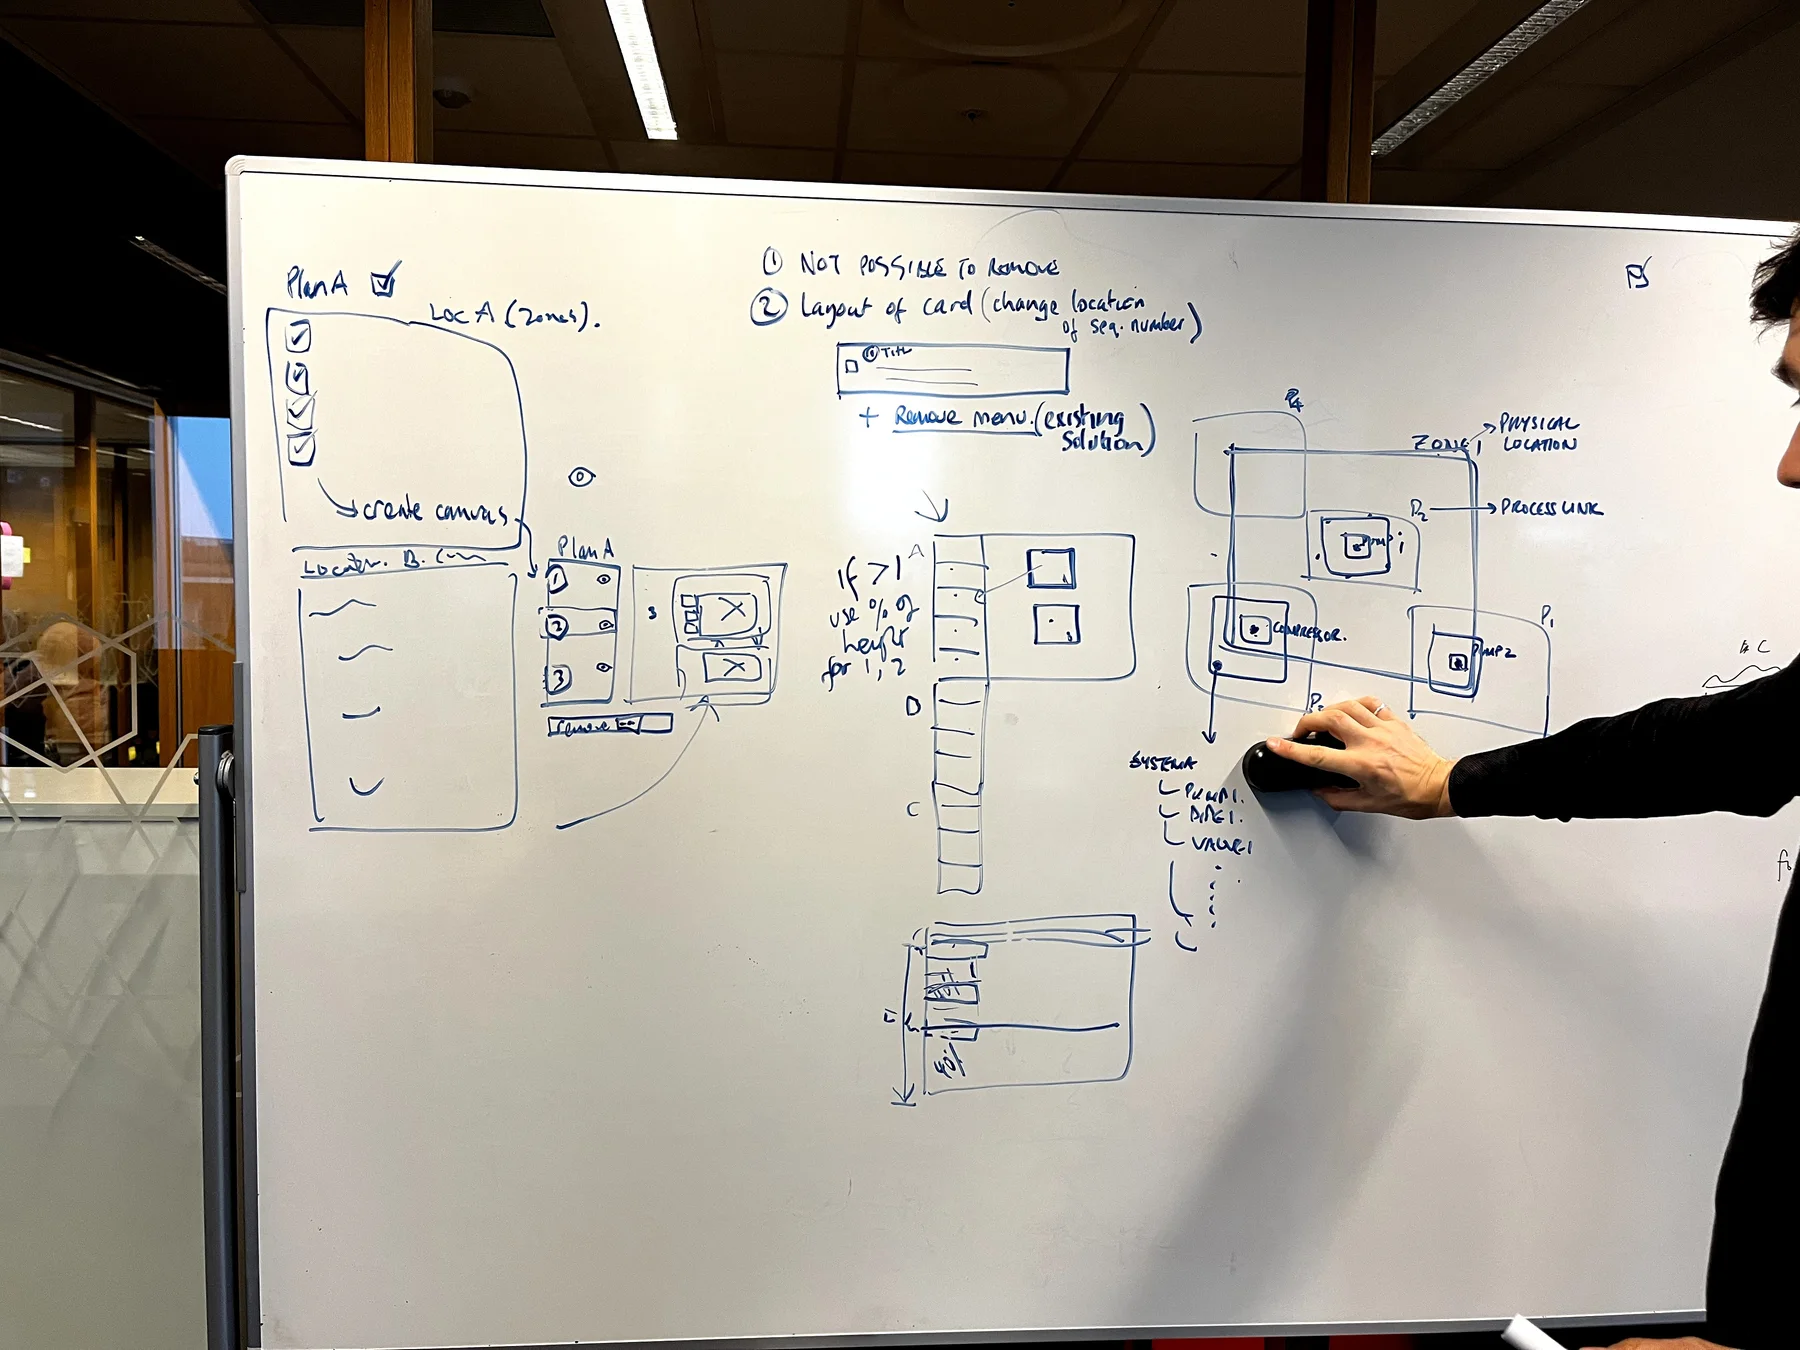
Workshop · from a plan to zones to a canvas per zone, on the whiteboard first.
“Can you start using it next week?” “Definitely. The same minute.”Offshore fabric maintenance, NOC, after a demo
“Super useful to see the work orders in and out of the plan in 3D, exactly what I need.”Planner, NOC
“A worklist that takes one to two weeks can take one day.”Planner, NOC
- “How can I see the conflicts and spread of work that I need to plan?”
- “Can the same team do work in locations that are close by?”
- “Can work in the same isolation boundary happen together?”
- “How can I see the risk associated with the work I am planning?”
Questions planners asked in research. Each one maps to a view or a filter in the product.
Every feature answers something we heard.
Research ran the whole way. The concept and the audit set the core of the product. The site visits in Sep–Oct 2022 came after Maintain was already running with OMV data, and shaped what followed, like job mapping for NOC.
| What we heard | What we designed |
|---|---|
| P&IDs are too hard to find, and work orders are not tied to a place on the plant. | Job mapping: work orders pinned on drawings, grouped by platform, deck and zone. |
| “Sometimes someone sends something by email and it gets lost.” Shift handovers drop context. | Comments and shared plans, with access to view, suggest or edit. |
| “We have a material dashboard. We don’t have confidence in it.” | Material status inside each activity. |
| The integrated planner can’t approve a change: “The functional planners are the ones who actually make it.” | Suggest, then approve: the IAP suggests a date, the plan owner decides. |
| Planners don’t know how assets connect: a valve next to a pump can belong to another production system. | Network map of the production system, with activities on its nodes. |
| Planners need to try a plan before it’s real. | Plans as a sandbox: drafts, then frozen plans. |
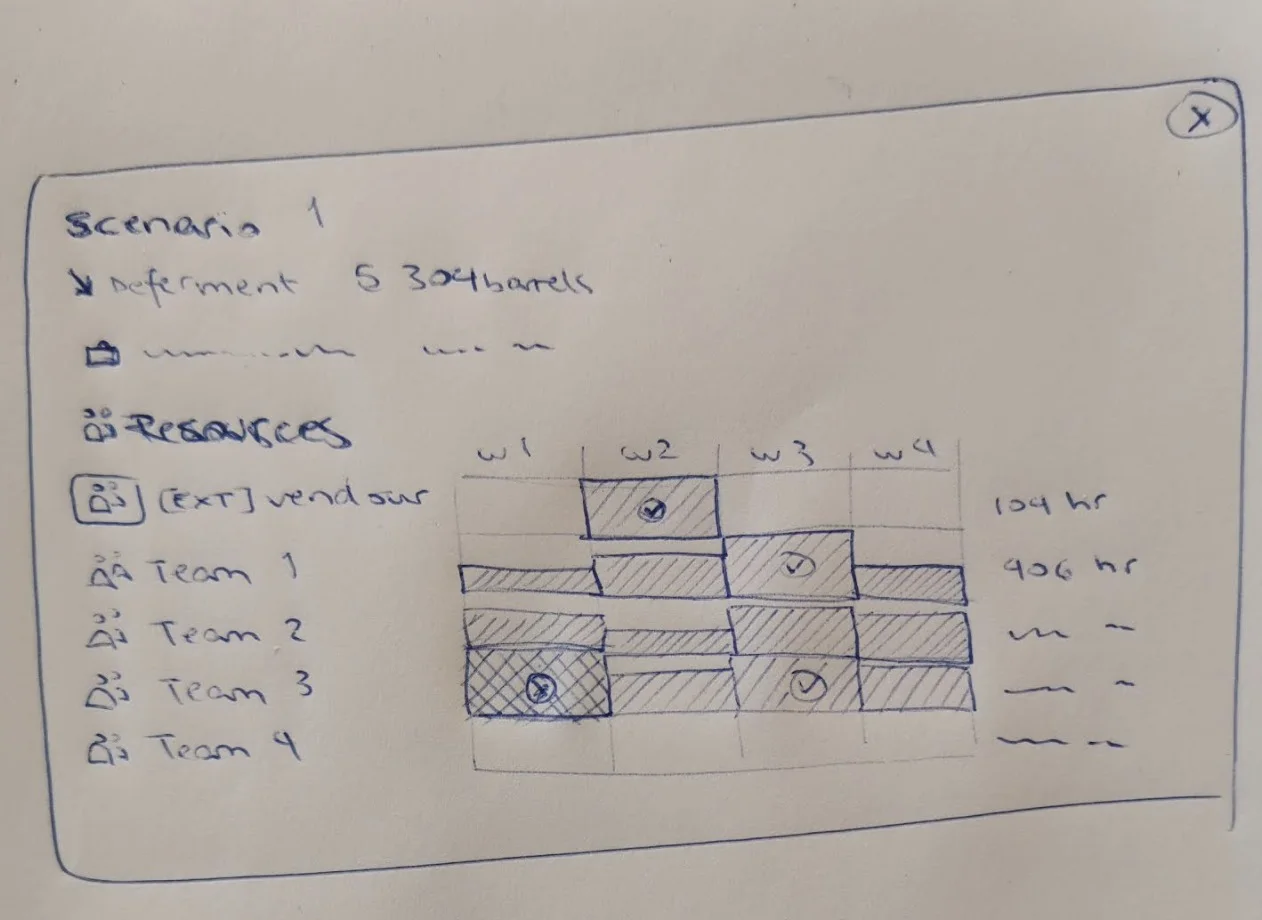
Plans as a sandbox, sketch · one scenario with its deferment and the load on each team, week by week.
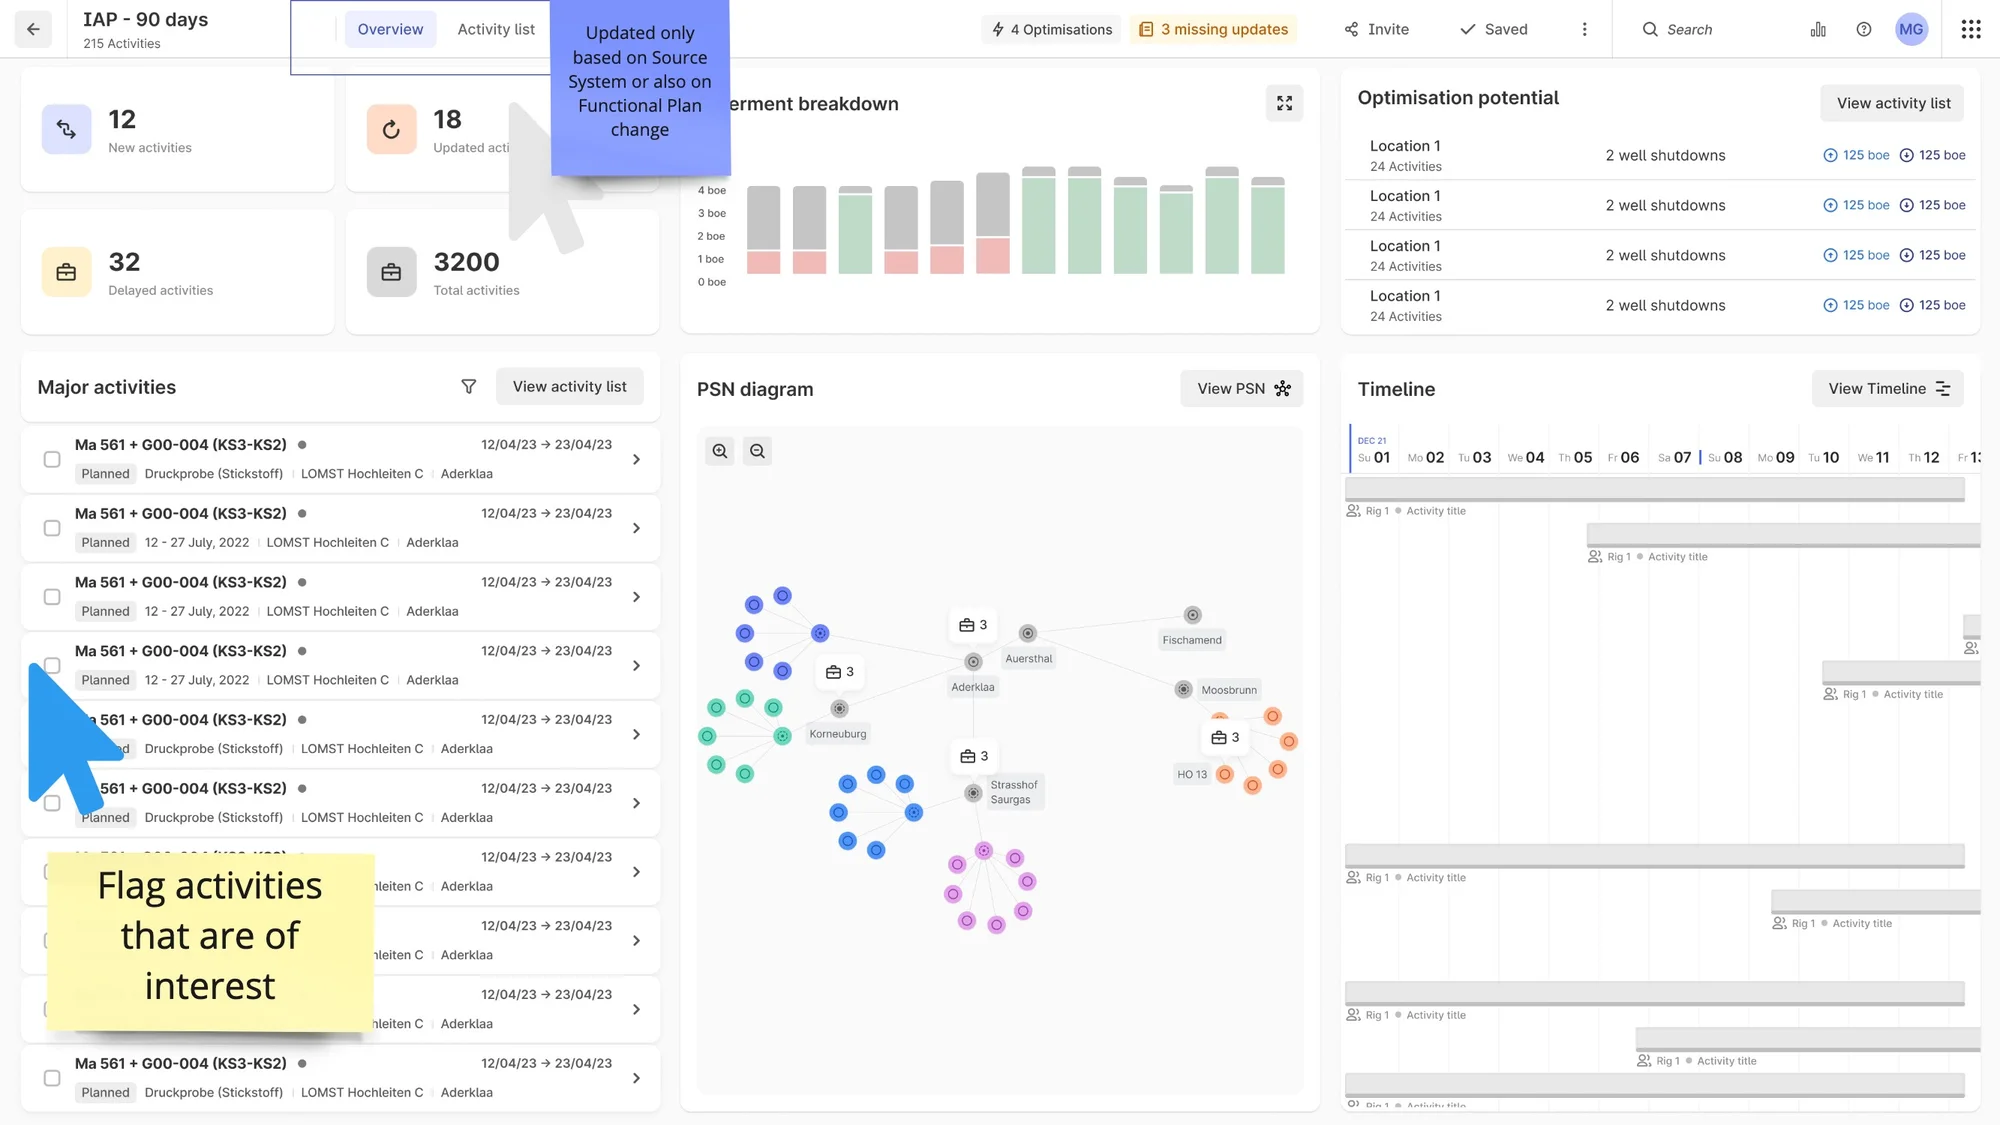
The IAP overview · new, updated and delayed work, deferment, optimisation potential and the production network on one page.
From a dark concept to the app planners use.
The concept came first, dark, with plans, people and 3D. Then a light planner with the numbers that matter. Then the live app.
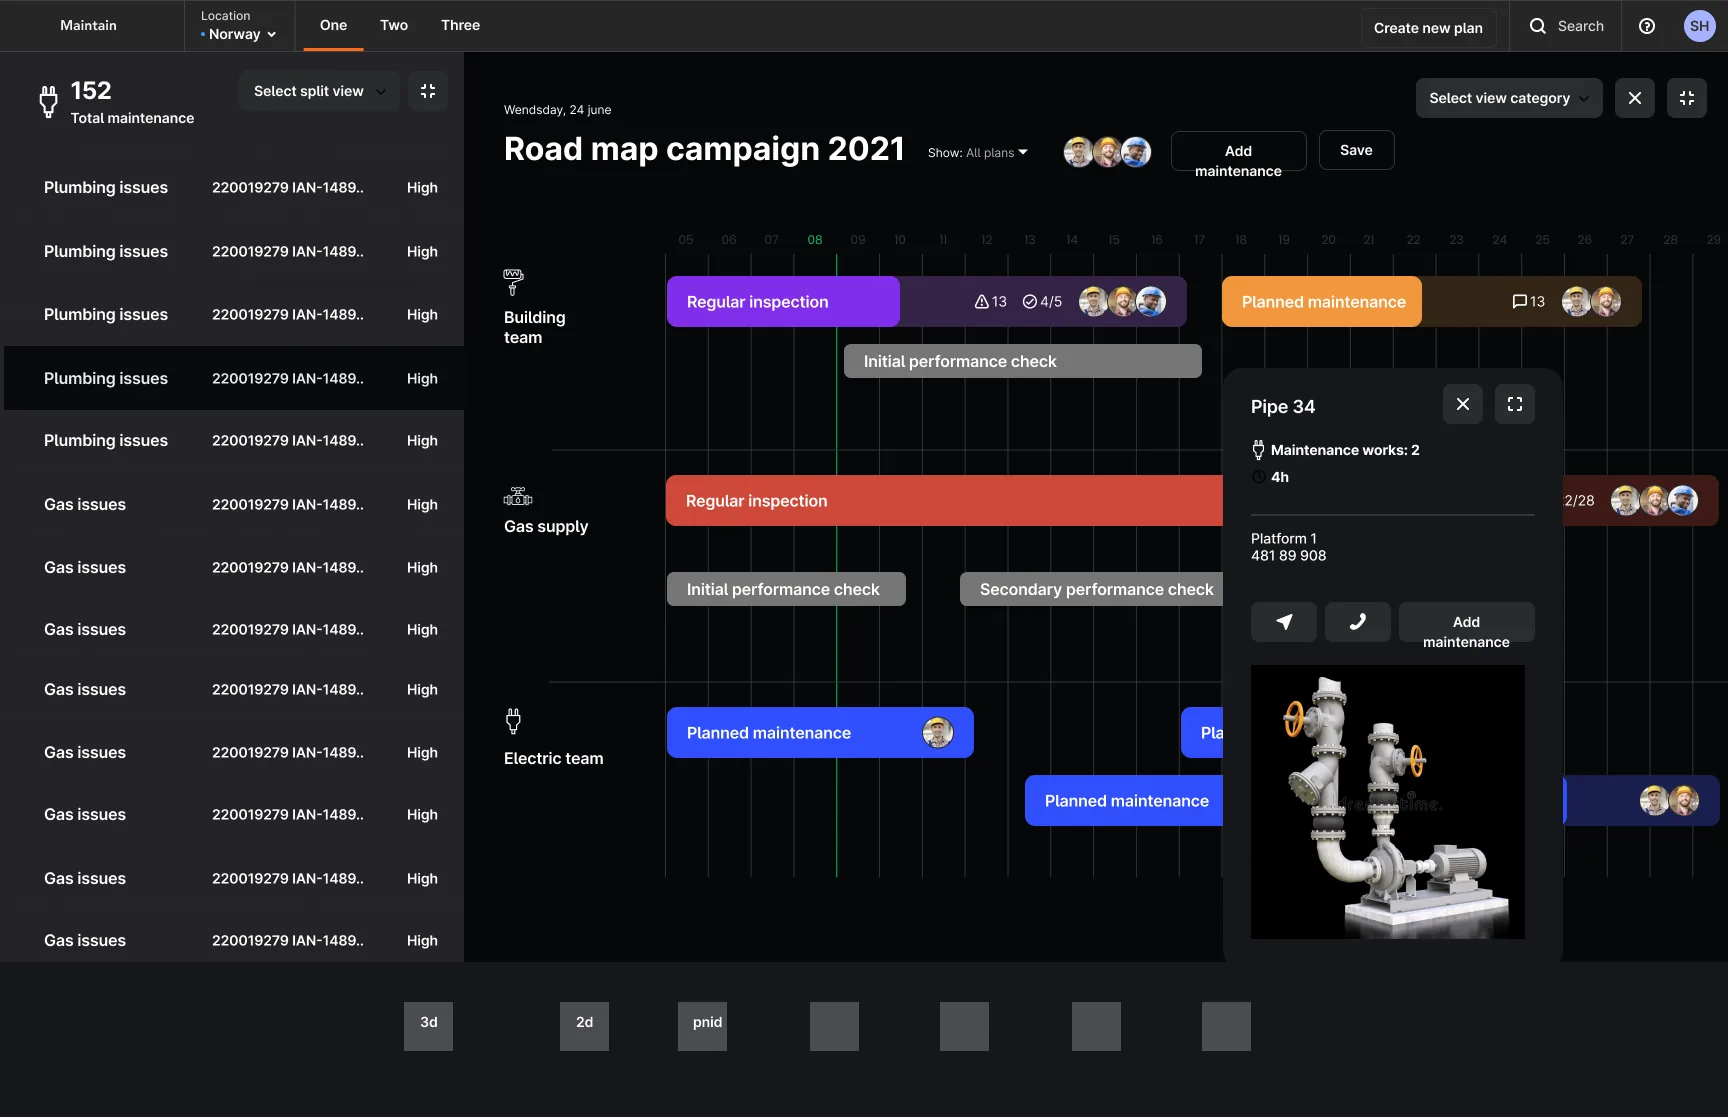
Plans, people, 3D
A Gantt by team, with any pipe opening to its 3D model.
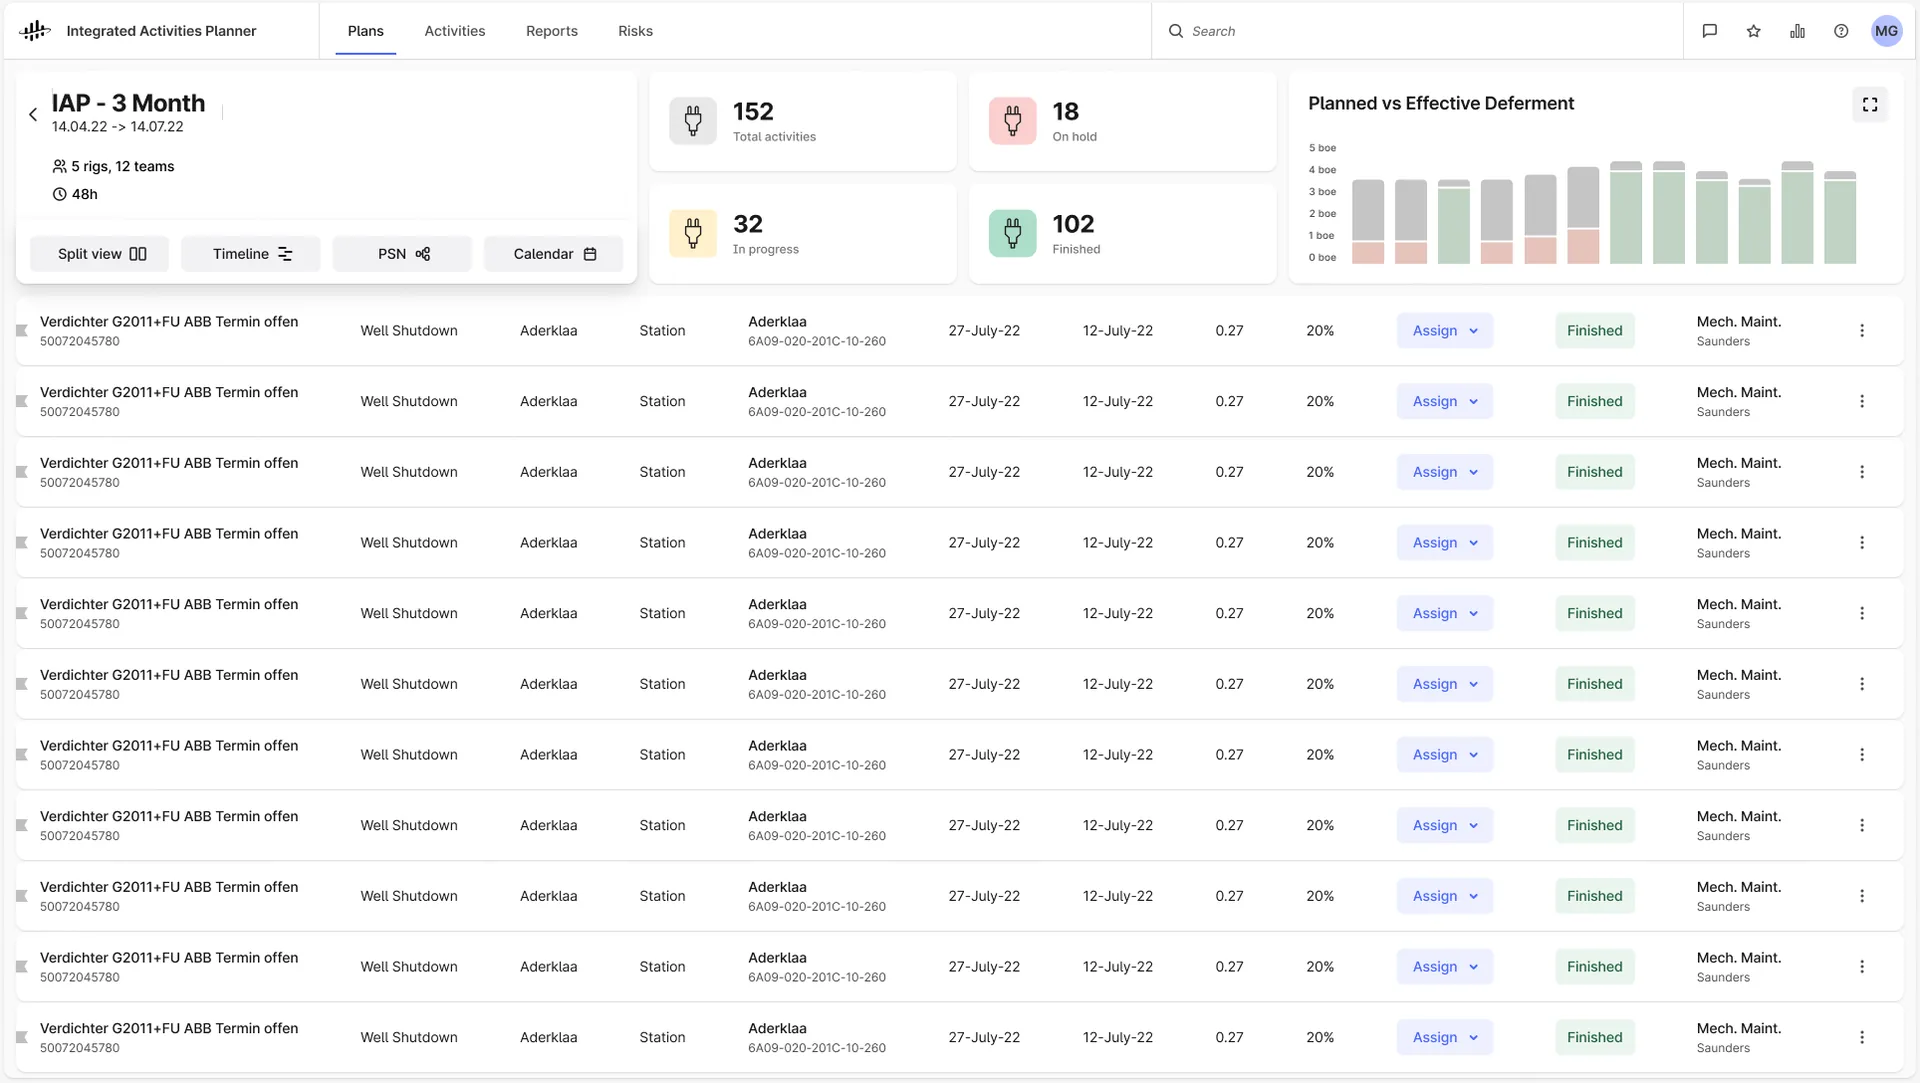
The numbers that matter
Activities by status, and planned versus effective deferment.
Plans you own
Create a plan from a date range, a location and a discipline, then fill it with activities.
Where a risk meets the plan.
A concept from the dark stage: a pressure drop on one pump, the same spot on the P&ID and in the 3D scan, and the 298 work orders it touches, with the teams it blocks.
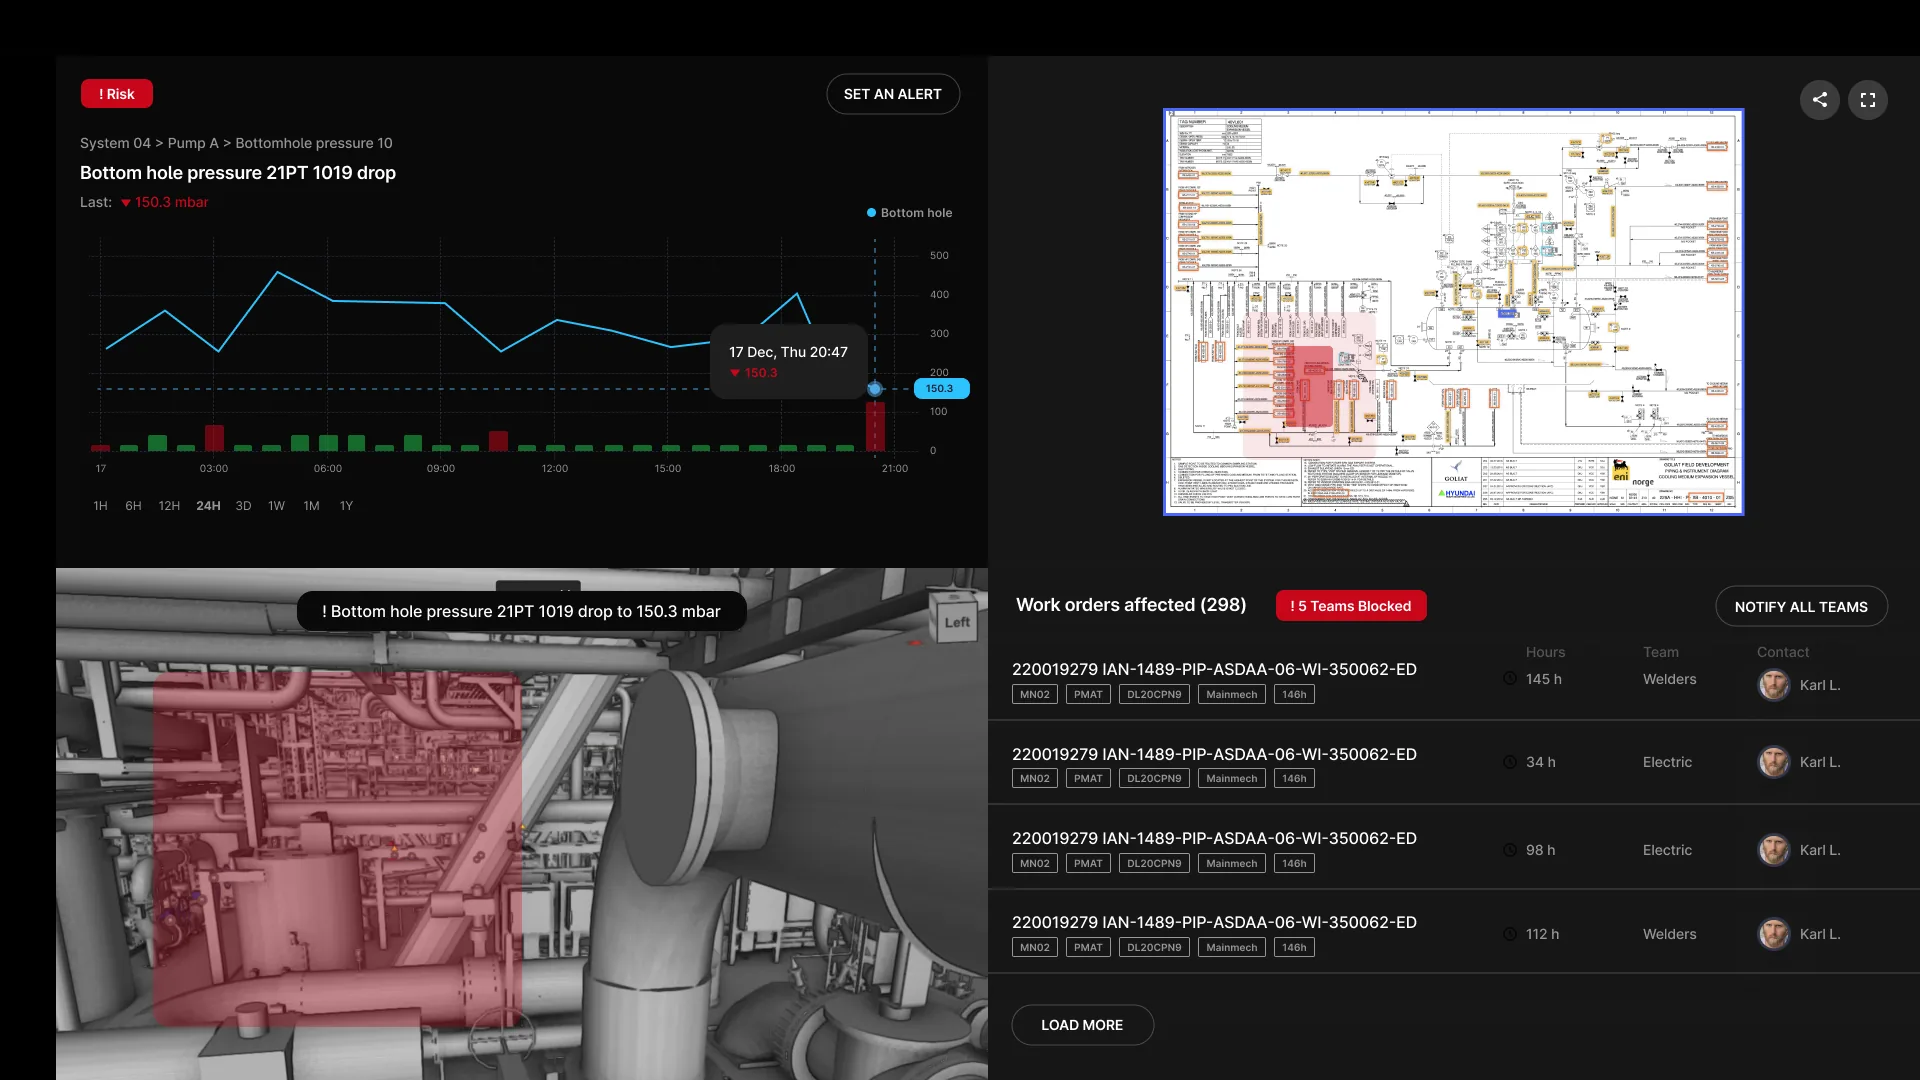
Concept, not shipped: alert, drawing, 3D and affected work orders on one screen.
One plan, three ways to see it.
One activity list stays on the left. The right side switches between a Gantt, a network map of the plant and a table, and the same filters drive all three. All clips below are from the shipped app, recorded in December 2022.

Table · the same activities as rows, with a shortcut to suggest an optimisation.
Network map · drill into a pipeline; the list filters to that asset.
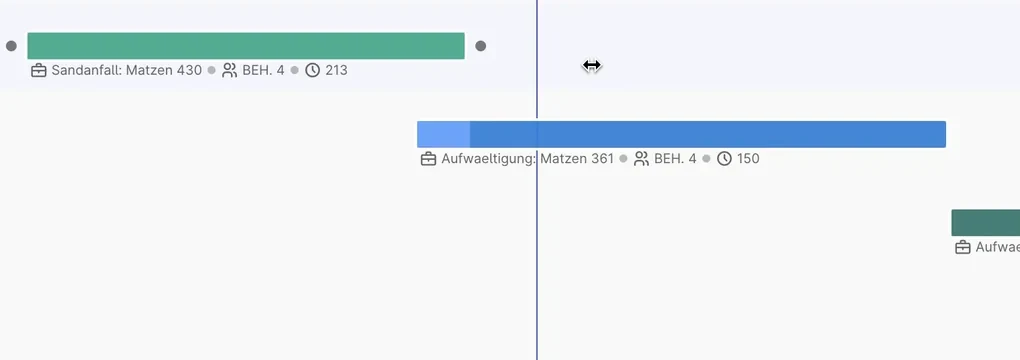
- Colour is the planner’s own category.Each category can be switched on or off from the legend, without leaving the plan.
- The bar carries its context.Location, team and hours sit under each bar, so nobody opens a panel to check.
- Handles to change dates.The selected bar gets handles at both ends; the today line keeps everything anchored.
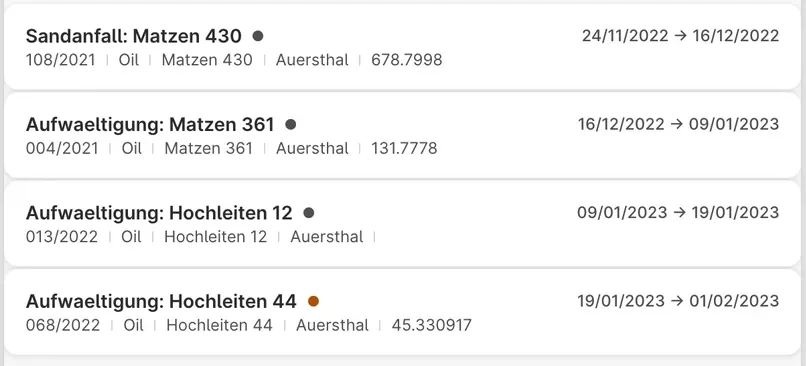
- Two lines per work order.Name and dates first, then number, stream and location: dense enough for 300 activities, readable at a glance.
- Grouped like the plant.Work centre, then section, then the activity, so the list mirrors how planners think.
Gantt · switch categories on and off in the legend; the bars and the list follow.
Group · regroup the same plan by functional location in two clicks.
Filters · one panel, here the next 90 days, drives every view.
Edit in the row · change a date inline; the baseline stays visible.
Filters, from usage data to one panel.
Filtering decides what a planner sees in every view, so we started from how people filtered already: usage data from the earlier tool, the SAP worklist and the planners’ own Excel files. One planner told us the activity type was useless as a field: “they write in the description that this is a PSV or HW activity,” so they needed open text filters.
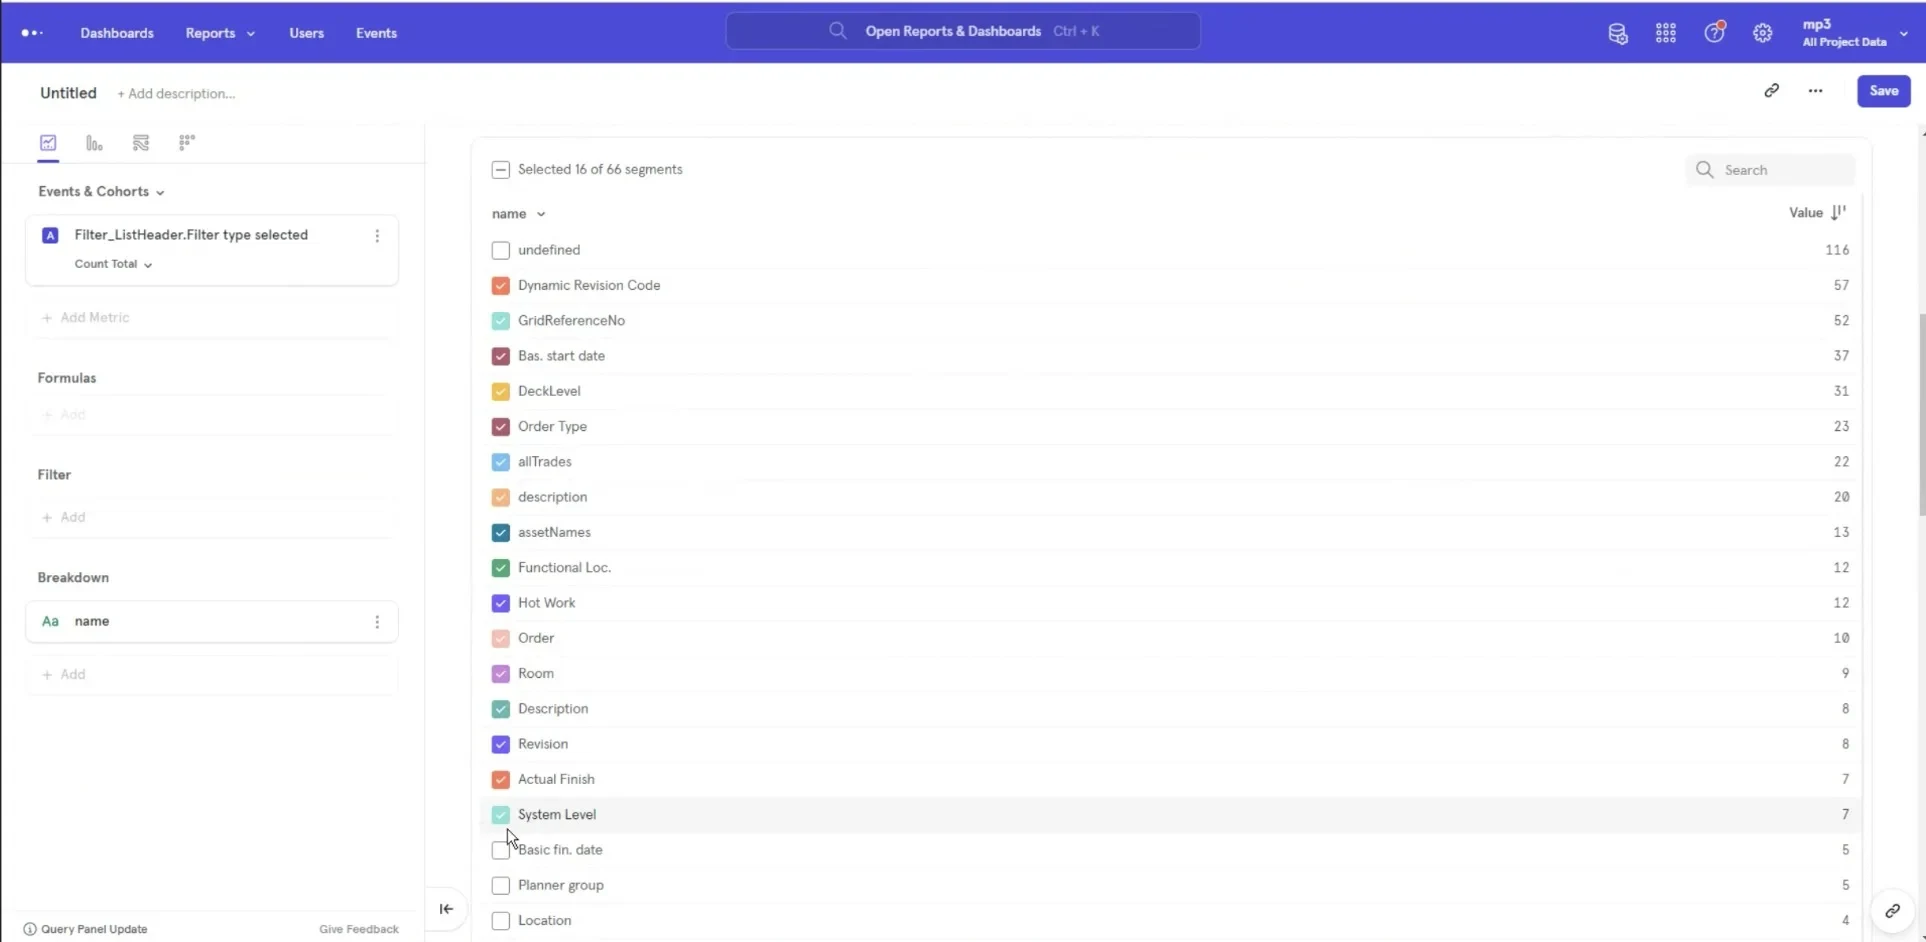
Usage, Mar 2022 · which filters people actually used in the earlier tool.
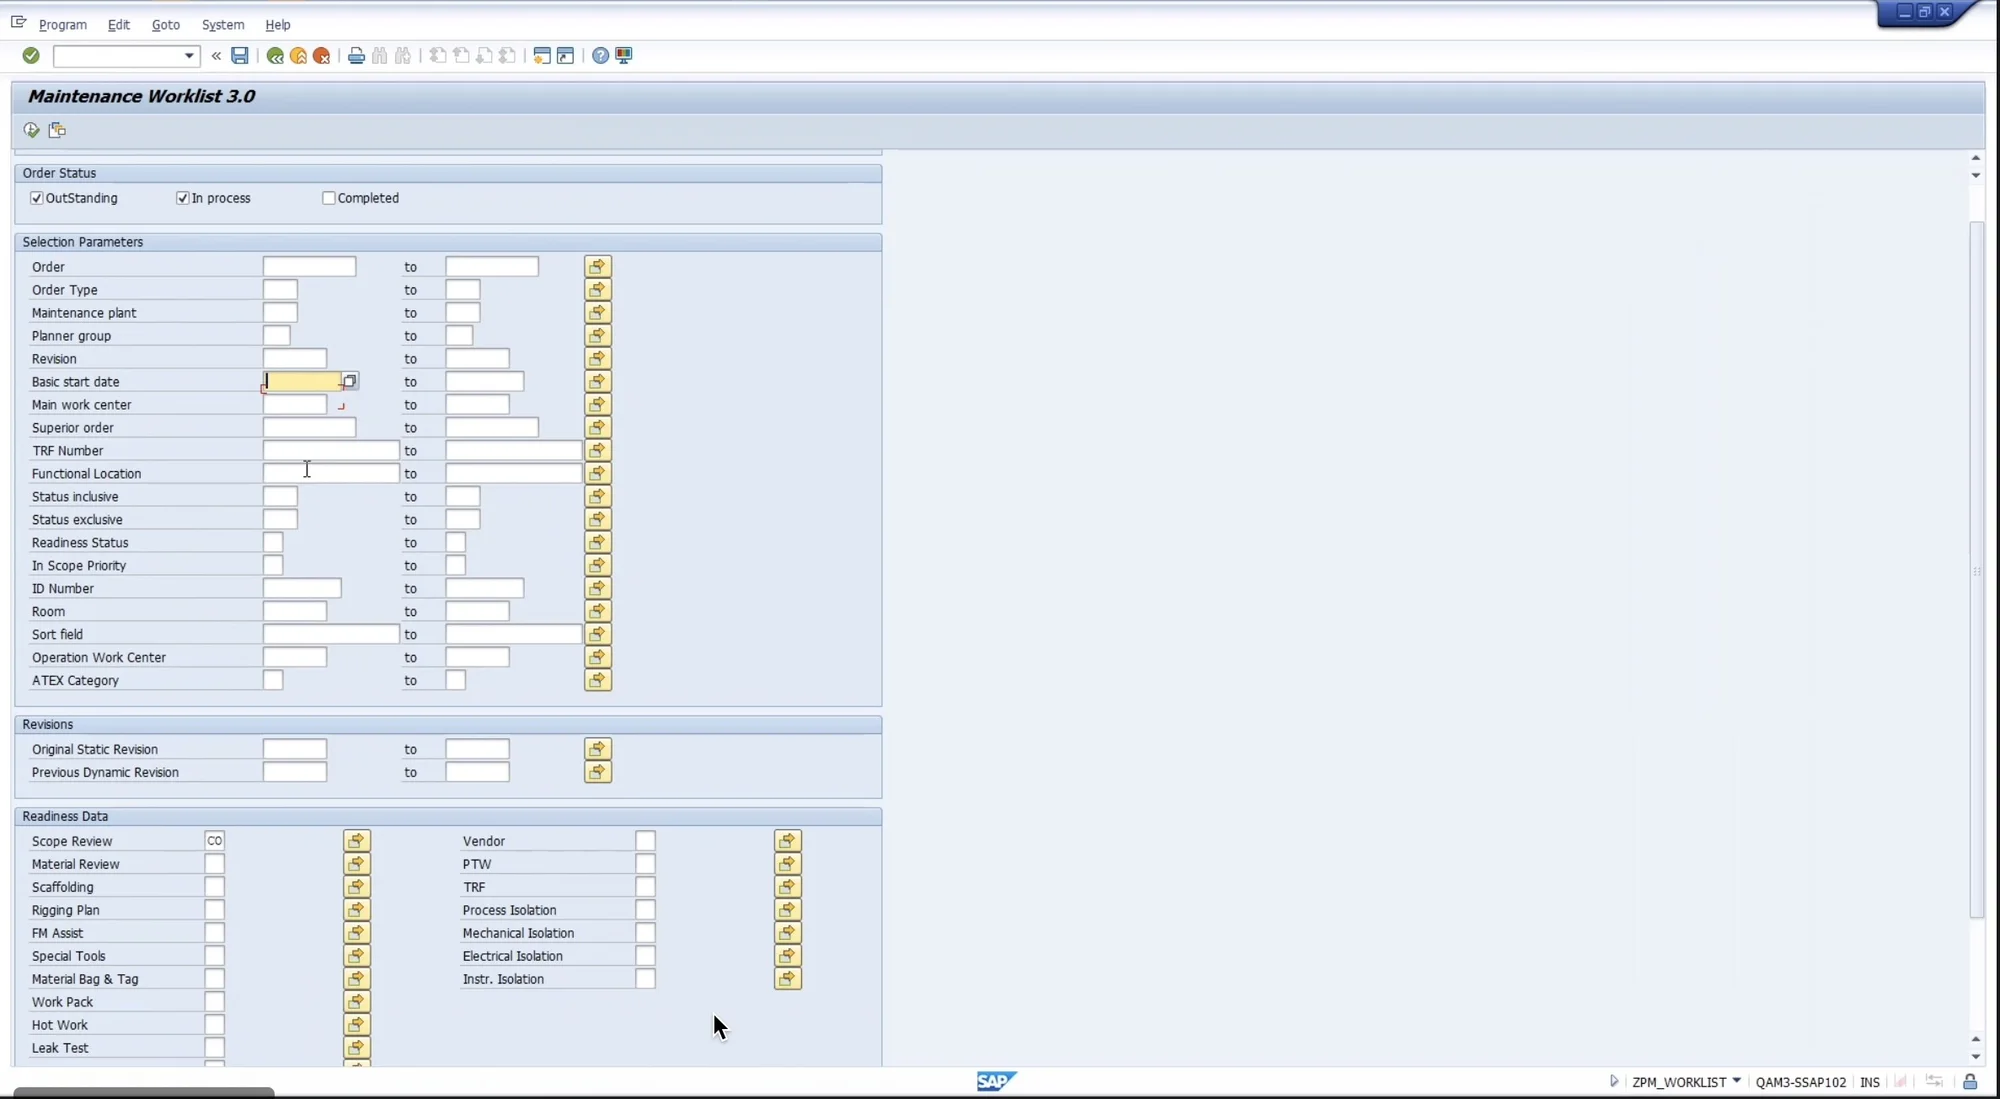
The SAP worklist · where planners filtered before.

The final panel · filters apply as you click, show how many activities each one keeps, and open text finds “PSV” wherever planners wrote it. An idea we took from Cognite’s Discover team.
One planner suggests. The plan owner decides.
The integrated planner sees the whole plan but can’t change a functional plan: “The functional planners are the ones who actually make it.” So an optimisation is a suggestion. It shows the original and the new date and who suggested it, and it waits for the plan owner.
- Before and after, side by side.The original and optimised dates sit together, so the change is obvious.
- A name on every suggestion.Who suggested it and when, so the planner knows who to ask.
- Two equal choices.Dismiss and Approve are the same size: the system never nudges the decision.
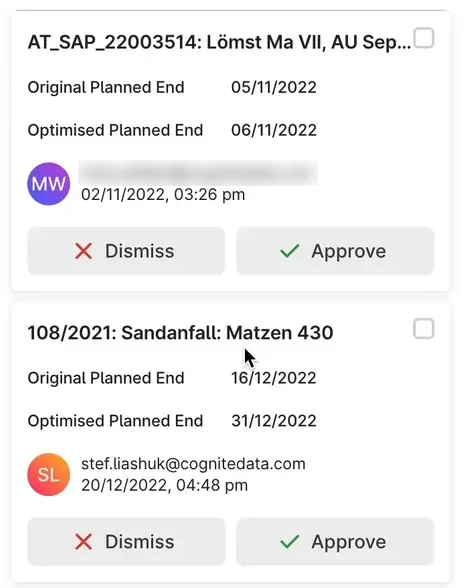
Optimisations panel, shipped app.

Running with OMV data, Aug 2022 · a suggested new start date waits for the plan owner, next to the barrels each activity defers.
Features planners asked for, shipped one by one.
Each feature started from one sentence about how people worked today.
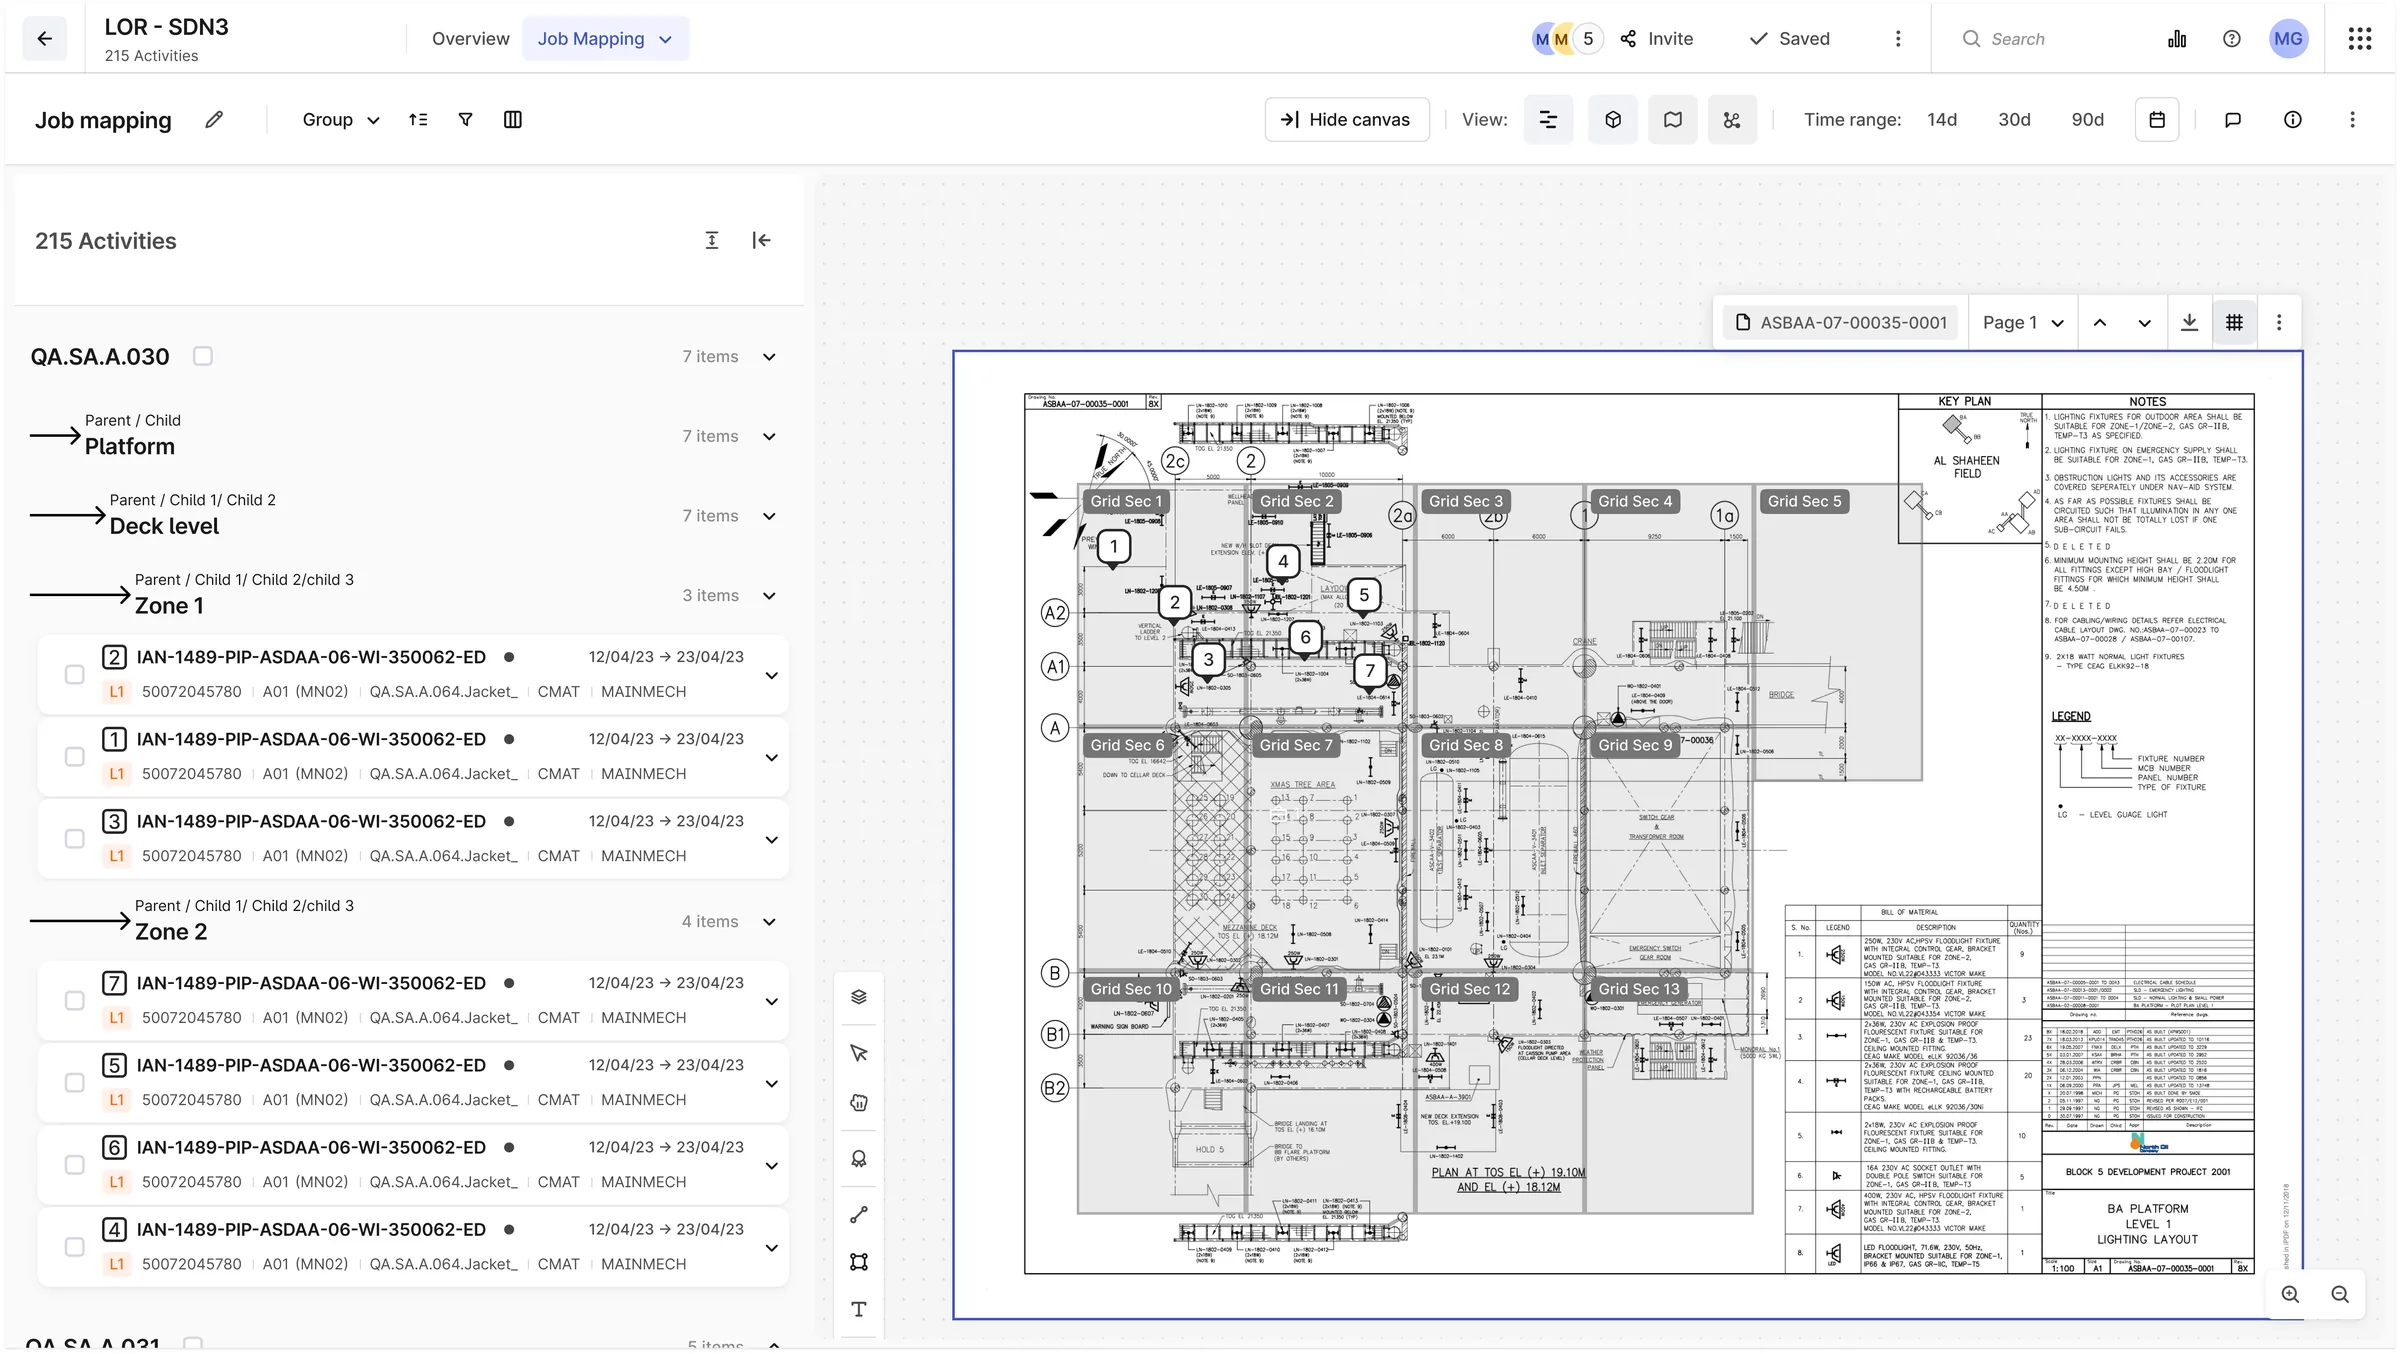
Job mapping · work orders pinned in sequence on the P&ID, grouped by platform, deck and zone. Designed for NOC, Q4 2022.
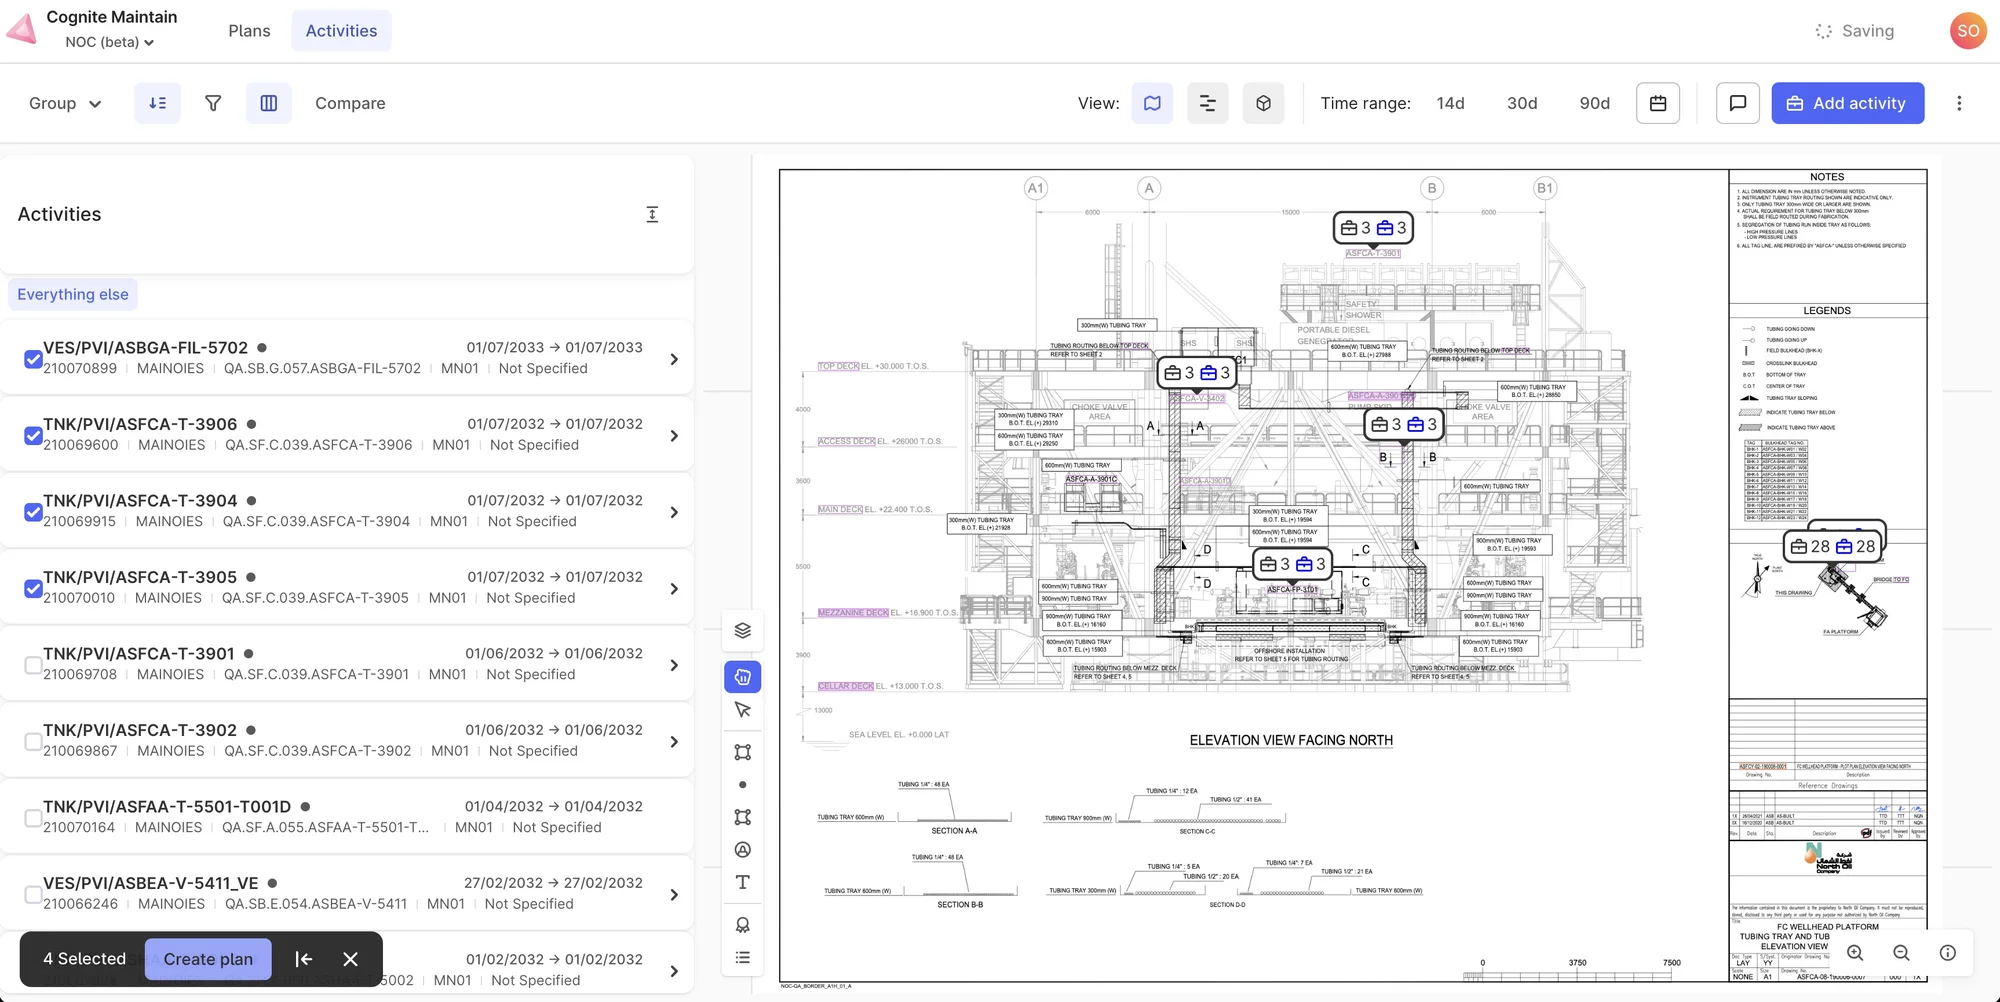
Live in the NOC beta, Nov 2022 · real work orders mapped onto a wellhead platform drawing; four selected become a plan.
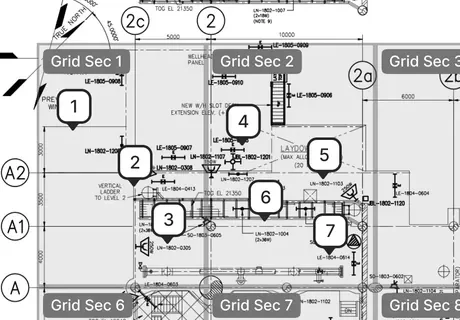
- Numbers are the sequence.Pin 1 on the drawing is row 1 in the list: the order of work, on the plant itself.
- Grid sections.The drawing is split into the same zones the list groups by: platform, deck, zone.

Comments
“Users are currently using emails to communicate the changes in each work order.”
Shipped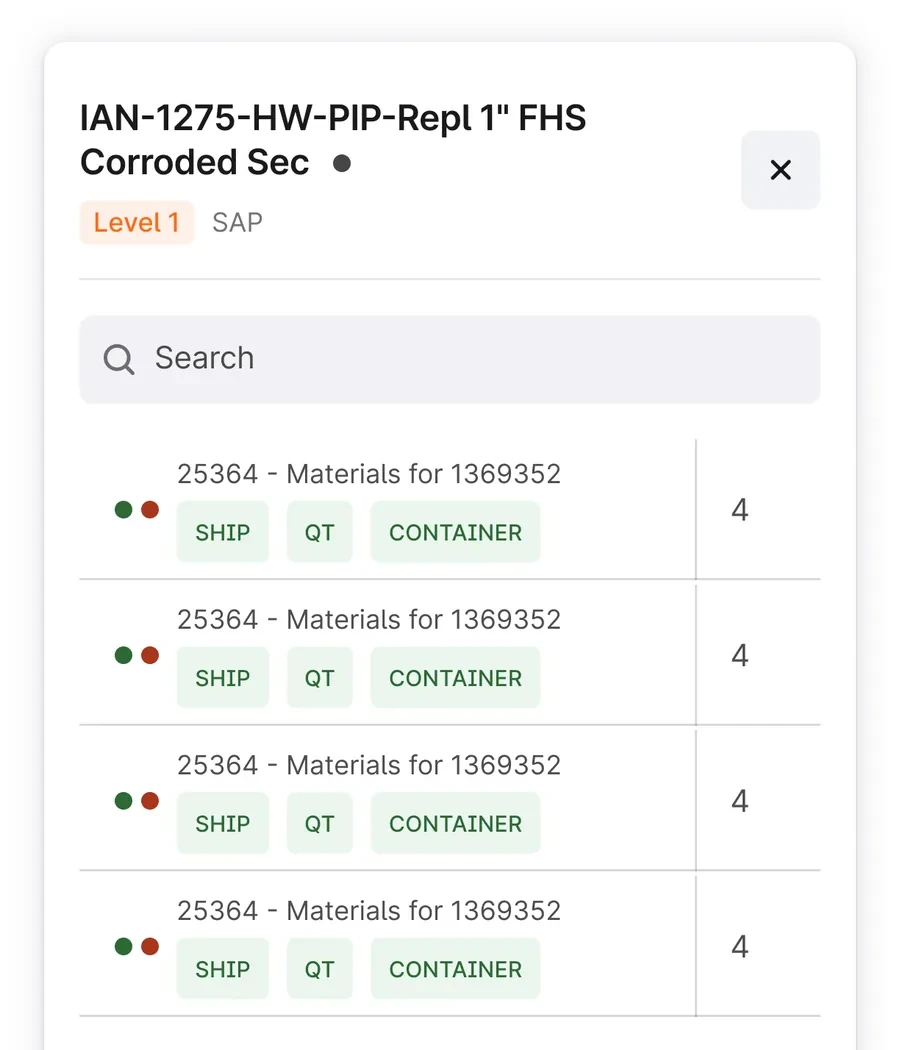
Material status
“Users want to check how many materials are required to execute the work order.”
In production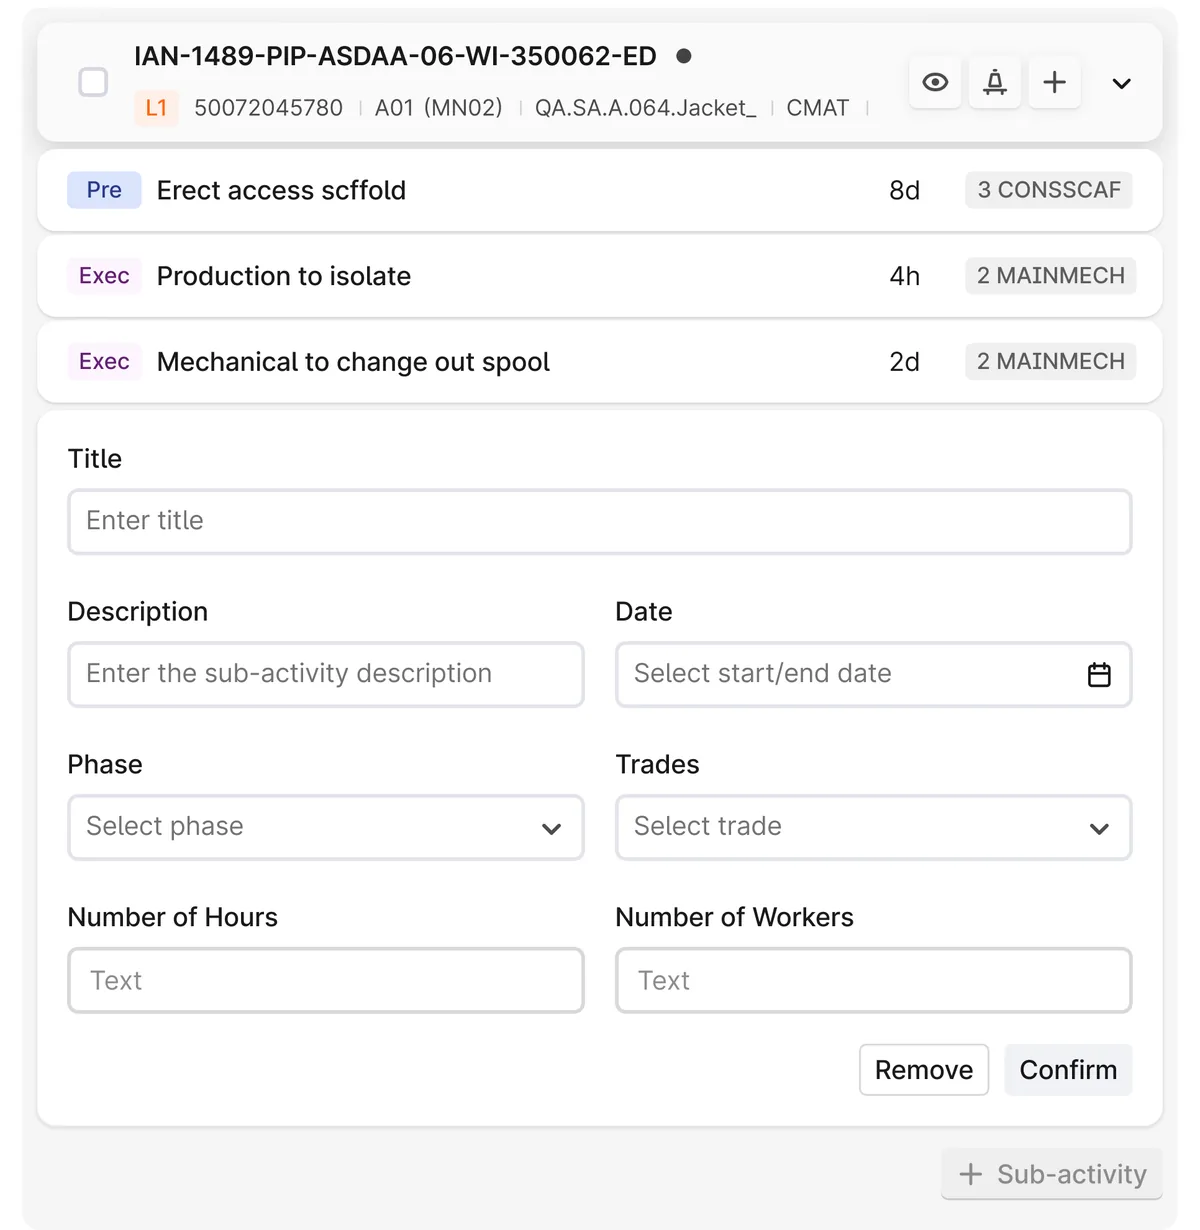
Sub-activities
Break a work order into steps: phase, trade, hours and workers.
In productionWhat we traded, and why.
- Plans first, with a direct path to activities.Some people work with a plan, others just look up a work order, and for them the old tool was quicker: “scopes mean nothing to them.” So the plan stayed the workspace, and the activities stayed one click away.
- A few fields over a configurable plan.Each site meant something different by “plan”, and a very configurable “create a plan” was versatile but confusing. We gave up flexibility and cut it down to a few fields.
- The meeting over the screen.“Unless we change the behaviour of people across the org, this tool will not be a success.” So we designed for the IAP meeting the plan is used in, not only for one person at a desk.
Tickets, reviews and a library of our own.
The screens sit on Cogs, Cognite’s design system. On top of it we kept a Maintain library: activity cards, optimisation cards, Gantt bars, network nodes, pins, plan cards and empty states. A playground file assembled them into full screens before sign-off.
- One page per ticketThe development file had a page for every Jira ticket, with the spec, the states and a changelog next to the design.
- Design reviews in the fileBuilt screens were reviewed against the design with redlines, down to “shall be 16px not 8”.
- A guide for new usersA clickable user guide made from the running app, one track for the integrated planner and one for the functional planner.
Where I left it.
I left Cognite in December 2022, with Maintain running on staging with OMV data and in beta at NOC. 3D was planned for the next version. The concept at the top of this page shows one way it could work, built on the interface we shipped.