Robots walk the plant. People read one report.
InRobot is Cognite’s software for running inspection robots, Boston Dynamics Spot and drones, on industrial sites. The robot already collected gauge photos and thermal images on every run. I designed how operators and engineers read those results: one place for robots, missions, runs and assets, where every reading opens in place.
Given: Cognite’s brand set the look. The structure, flows and states are mine.
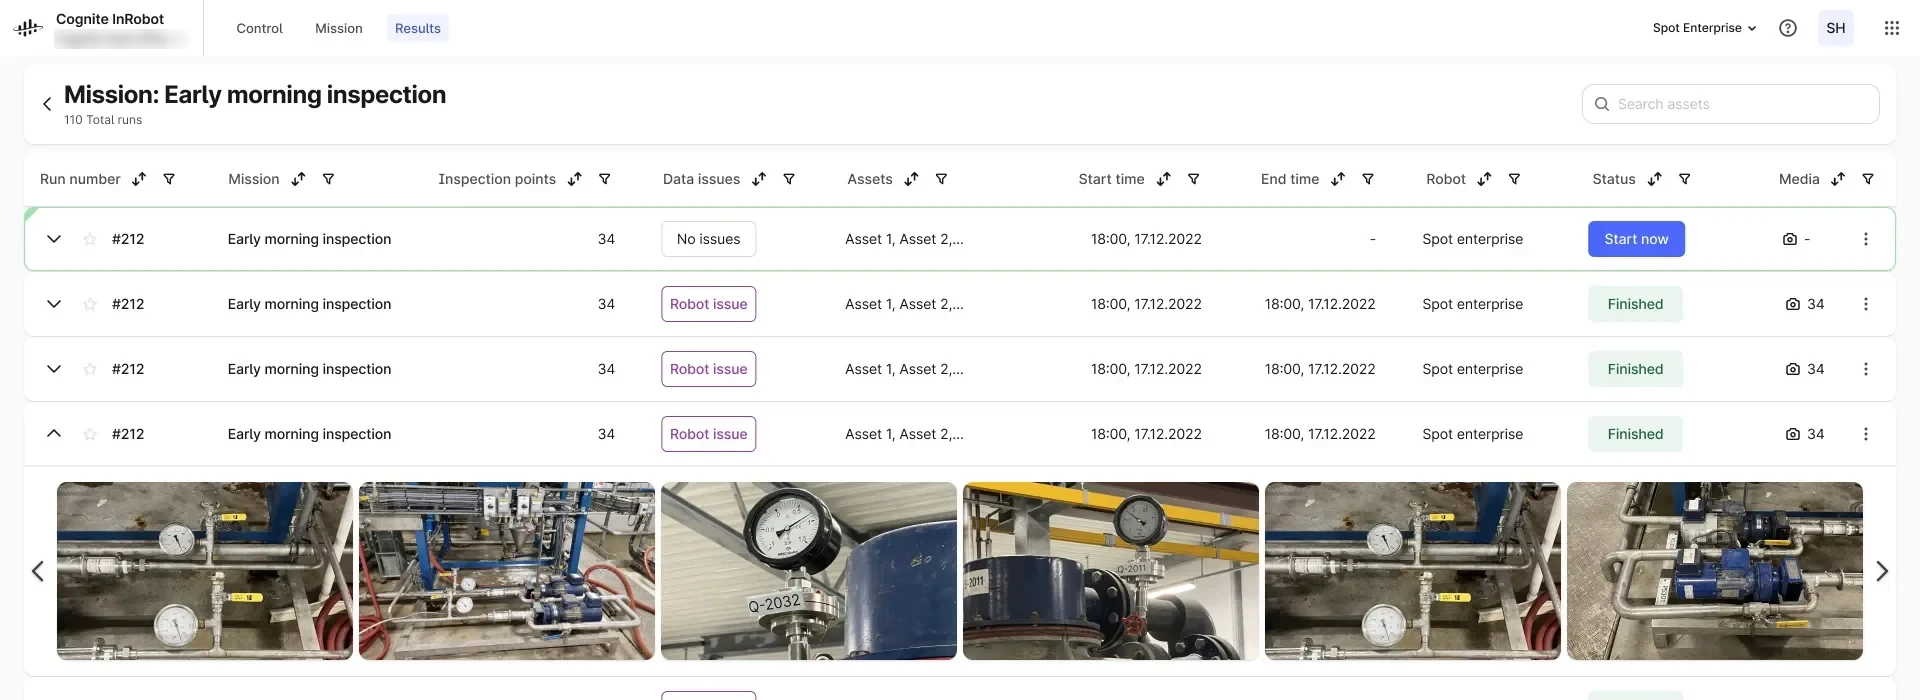
A mission’s runs, one expanded in place into its inspection photos.
The live product covered robot control and missions. Results had no home, and the review found 53 usability problems.
Designed Results from the information architecture up: robots, missions, runs and assets, with photos opening in place.
Results designed as a third area next to Control and Missions, built with a small InRobot component library shared with the team.
The same product, four years on.
A concept of how InRobot could work next, built on the 2022 research and the real site photos from the Mission report. The plant is a live 3D scene, the robot’s cameras sit beside it, and a reading goes to a work order in one click. Try it below.
Sam led research. I led the design.
InRobot was one of Cognite’s robotics products. I worked on it with Sam Medrington. We split it the way the project ran.
- ResearchSam ran the research and the user interviews.
- Heuristic reviewSam and I reviewed the live Control and Mission screens together against Nielsen’s 10 heuristics.
- Design, test, iterateI designed the new screens and the component library, tested them, and updated the designs after testing.
Three people, three reasons to read a report.
We ran a persona workshop for InRobot and Borregaard, then refined the personas with real people from the sites. The question we asked: who uses mission reports, when, and what stops the others?
- Maintenance operatorMaintains pumps on the Ivar Aasen platform in the North Sea. Wants mission reports that say what is wrong and where, and to drive the robot when he can.
- Daytime operatorWary of new tech. Happy for the robot to take the longest inspection route, as long as he never has to interact with it. Fears being replaced.
- Integrity engineerOrders data and wants it fast and processed. Frustrated by long waits, poor captures and false negatives. “Not have to baby the robot, it’s a tool.”
“Freeing humans from dangerous and repetitive industrial tasks.”Success in 2–3 years, product workshop, Aug 2022
“Low adoption of robots and low market traction for Cognite.”Failure in 2–3 years, same workshop
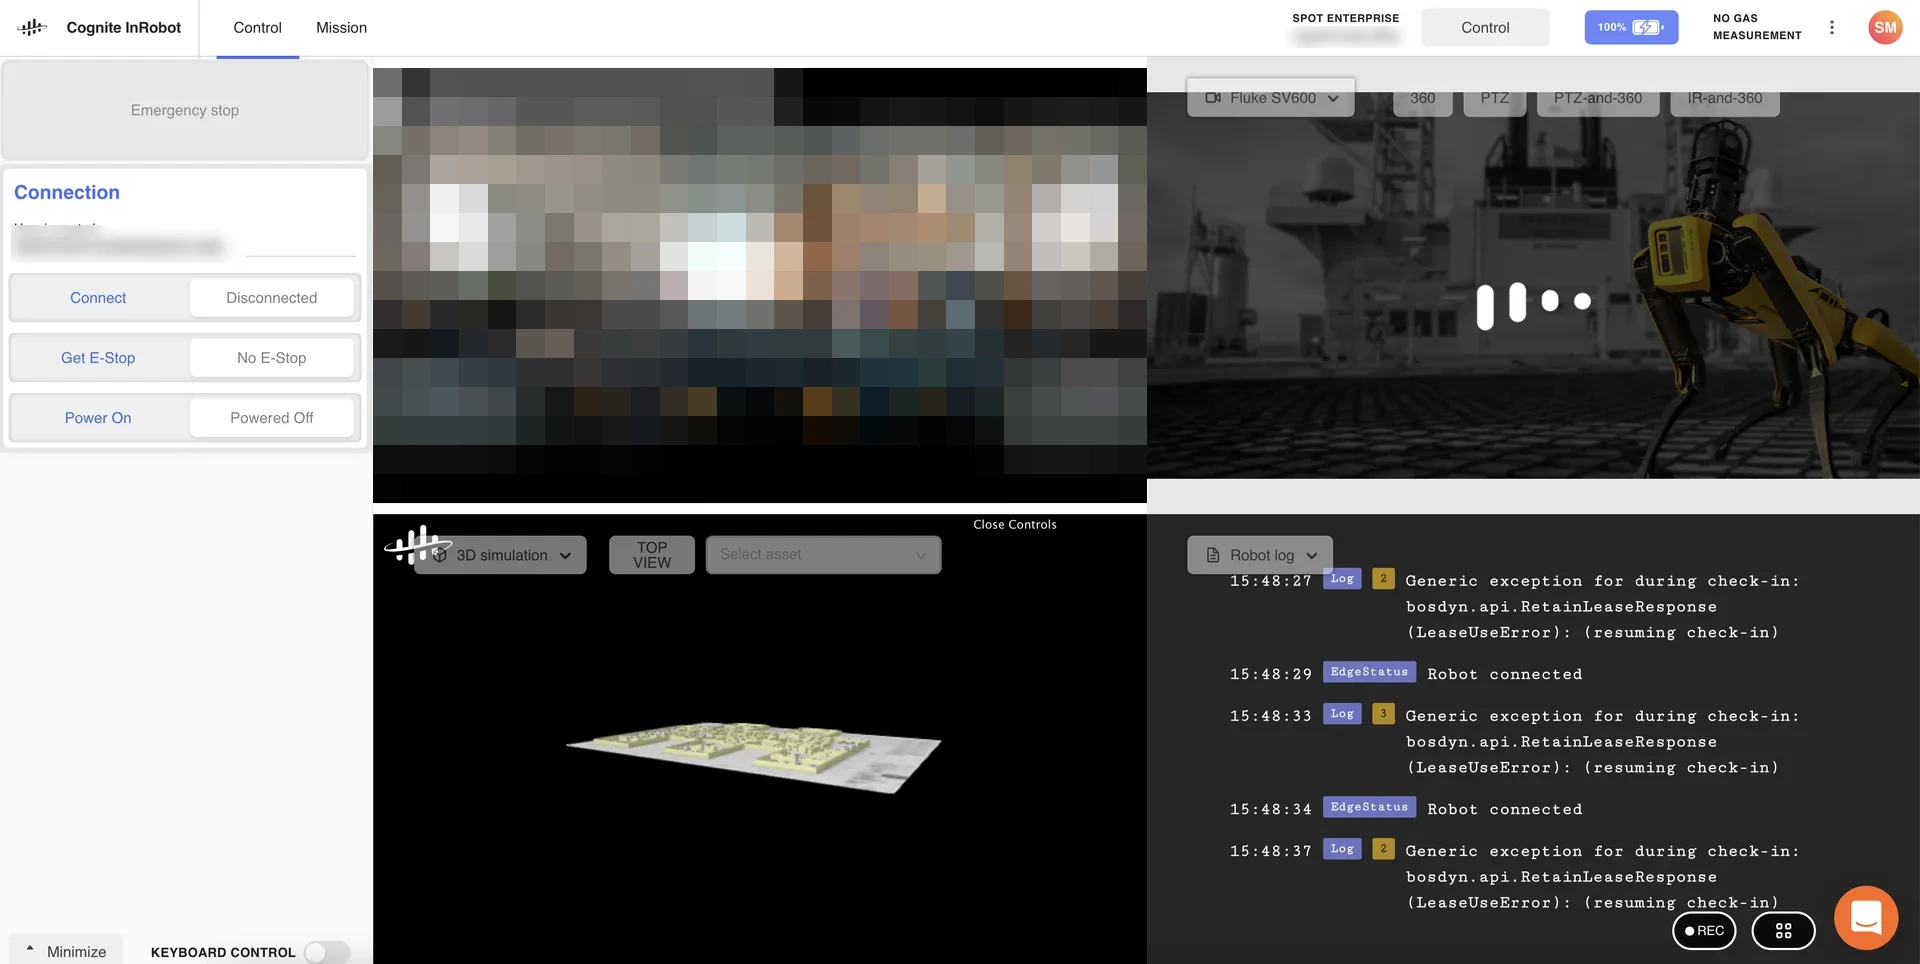
Before · the live Control screen we reviewed, 2022: connection controls, camera feeds, a 3D simulation and the raw robot log.
Built for the robot, not for the people.
The live product covered Control and Mission. A run produced dozens of photos and readings, but there was no place to read them.
- 18 findings on Control“Control options should all be disabled unless connected, powered on (+E-Stop)”
- 35 findings on Mission“Leaving Mission tab with unsaved changes loses all data”
Three areas, and a home for results.
I started with the map: Control and Missions stay, and Results gets its own branch, from missions to runs to every inspection point, and from assets to their history.
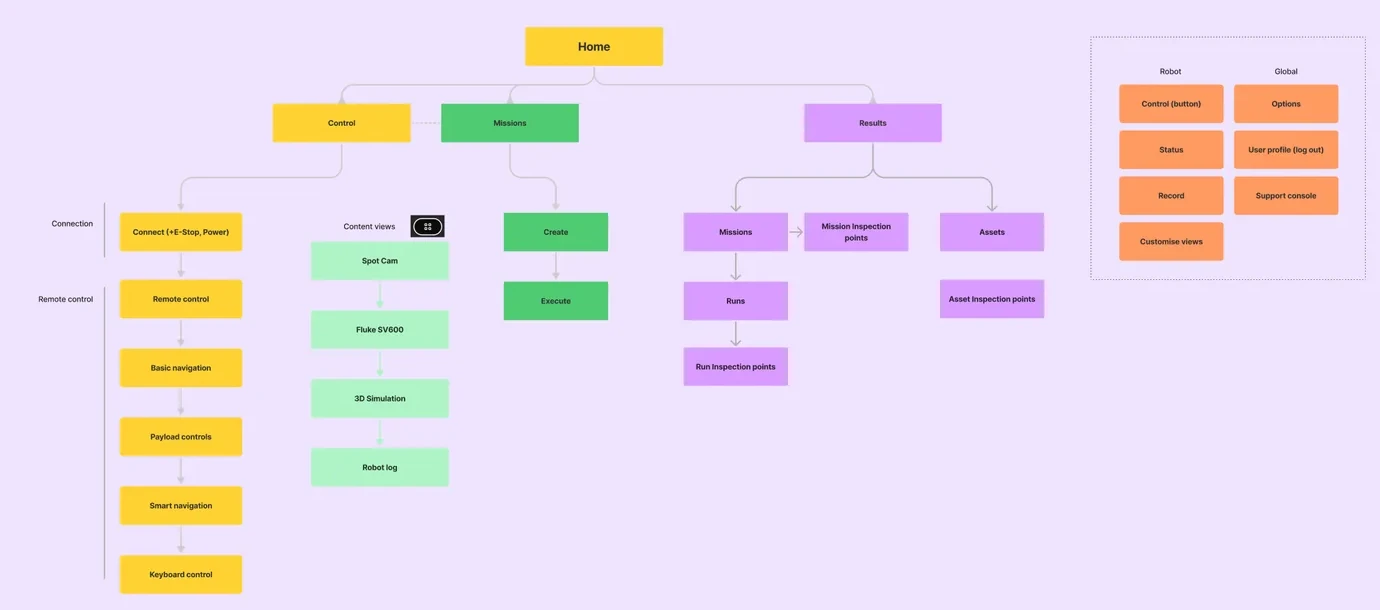
The information architecture: Control and Missions stay, Results gets its own branch.
Results that open in place, not page by page.
Every table opens inline, so a run expands to its photos without leaving the list, and the run page leads with the readings: one run row, then the inspection points.
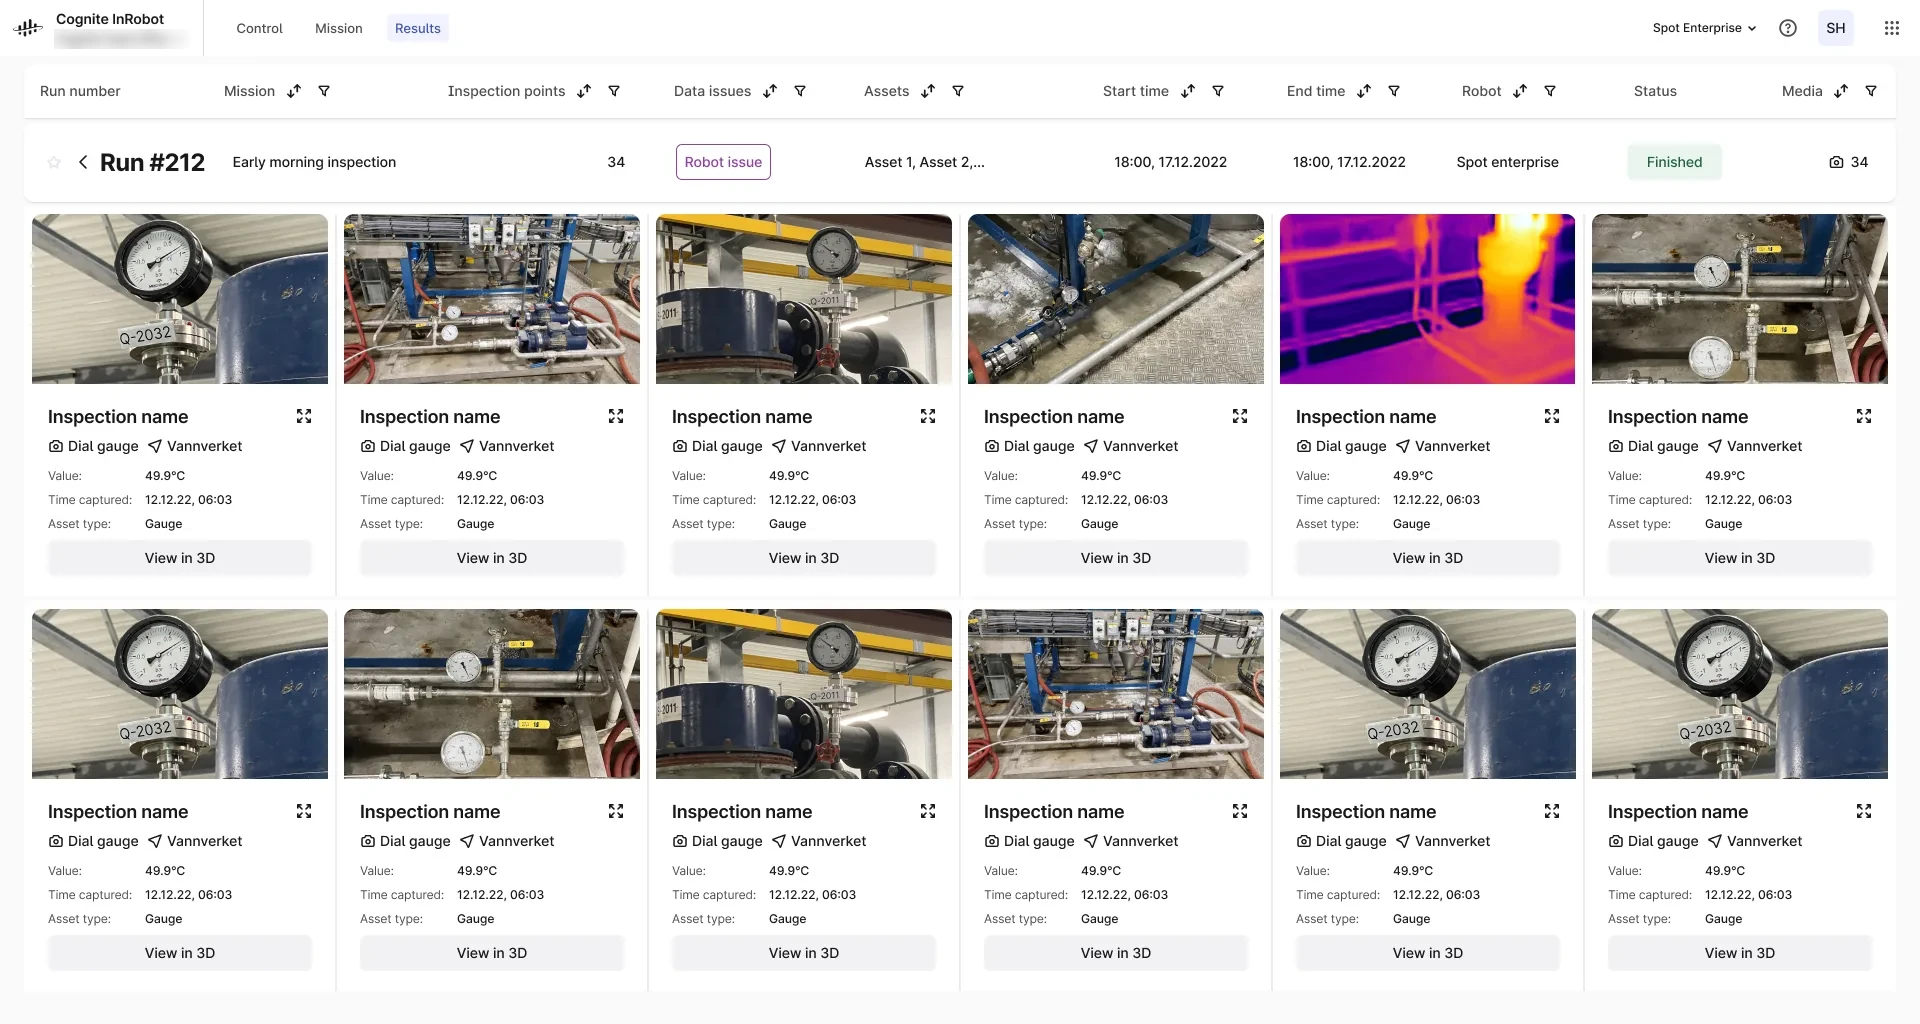
Run #212 · one run row, then the cards. Each card links to its spot in 3D.
Robots are shared, runs fail, data is visual.
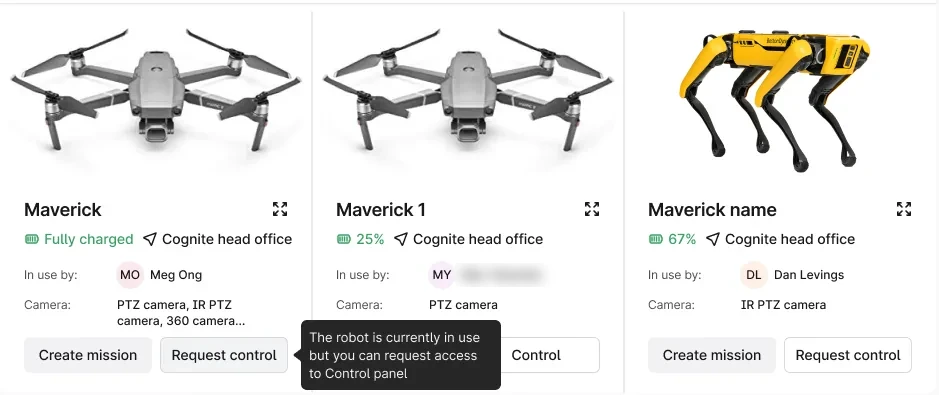
Who has the robot
Each card shows battery, site, cameras and who is in control. “Request control” explains itself in a tooltip.
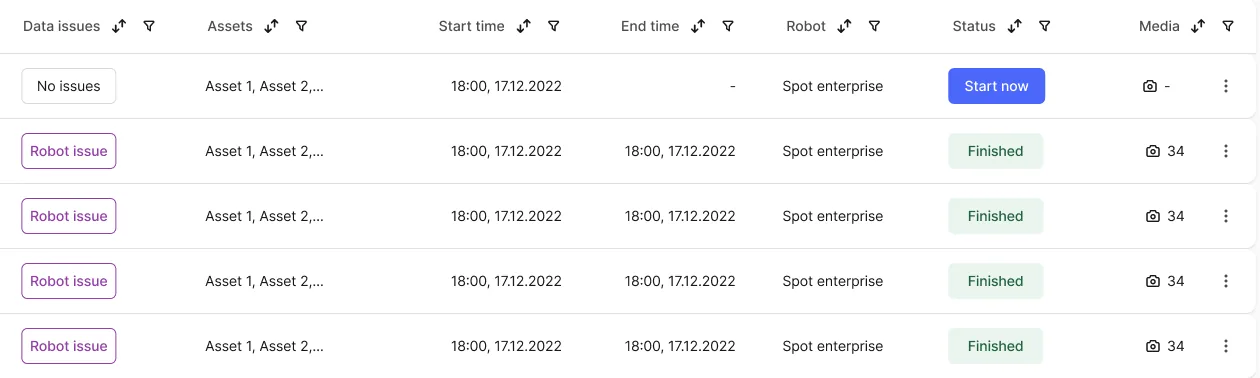
Issue ≠ status
A run can be Finished and still flag a robot issue, so the status never hides a problem.
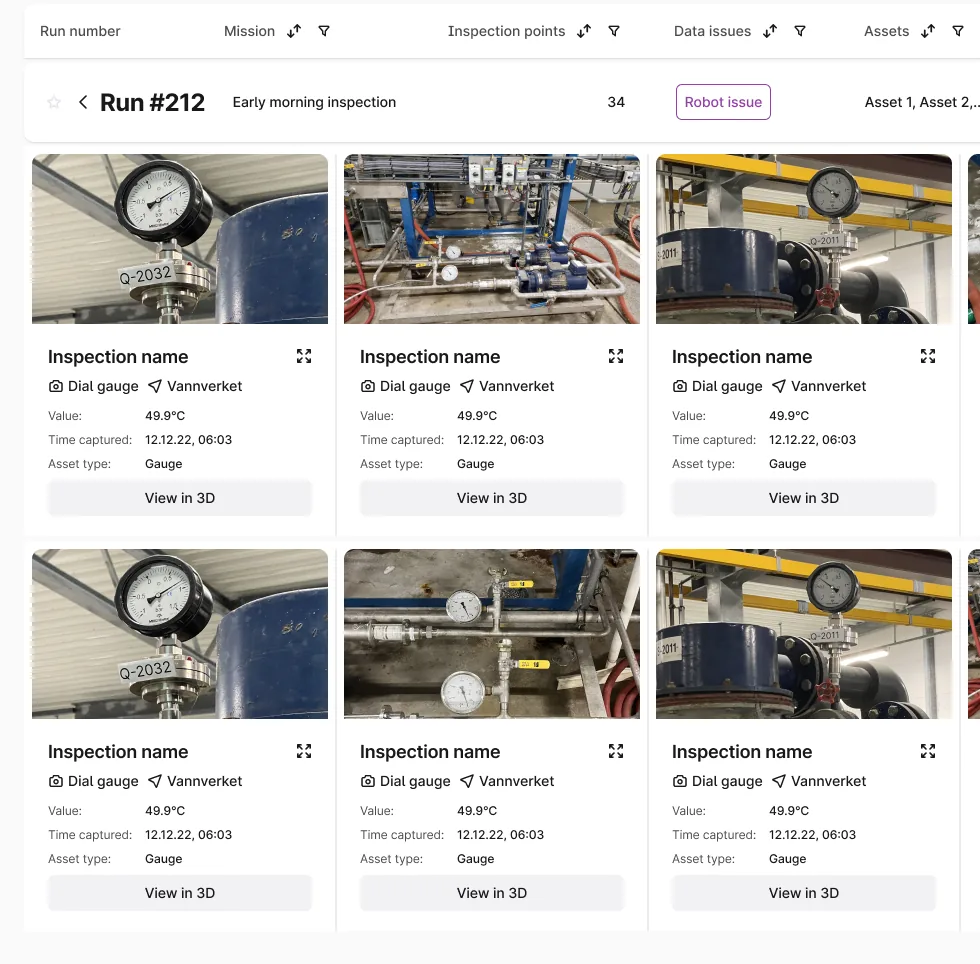
The photo is the data
Every inspection point is a card: image first, then value, time and asset, one click from 3D.
Missions, runs and assets on one pattern.
The same table pattern carries all three levels. Open a mission to see its last runs, open a run to see its photos, open an asset to see every capture of it.
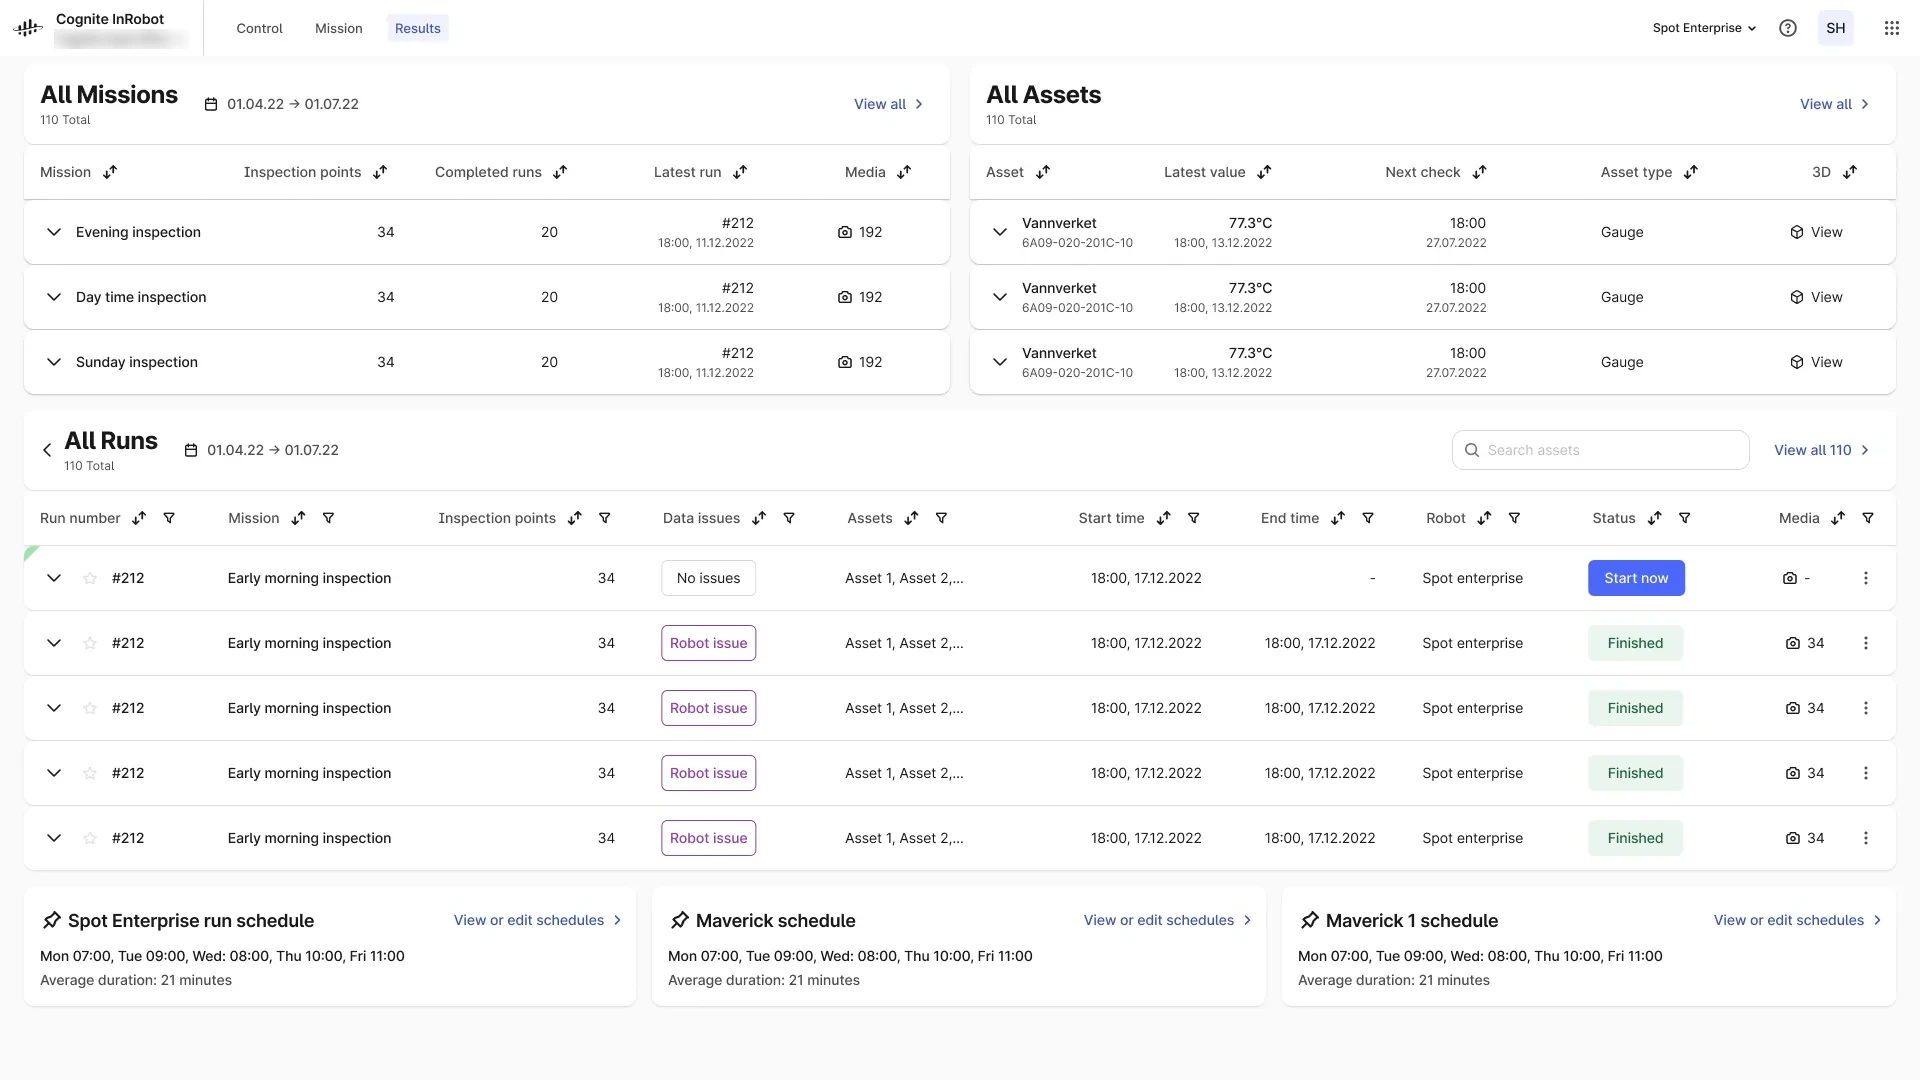
Results overview · missions and assets side by side, all runs below, each robot’s schedule at the bottom.
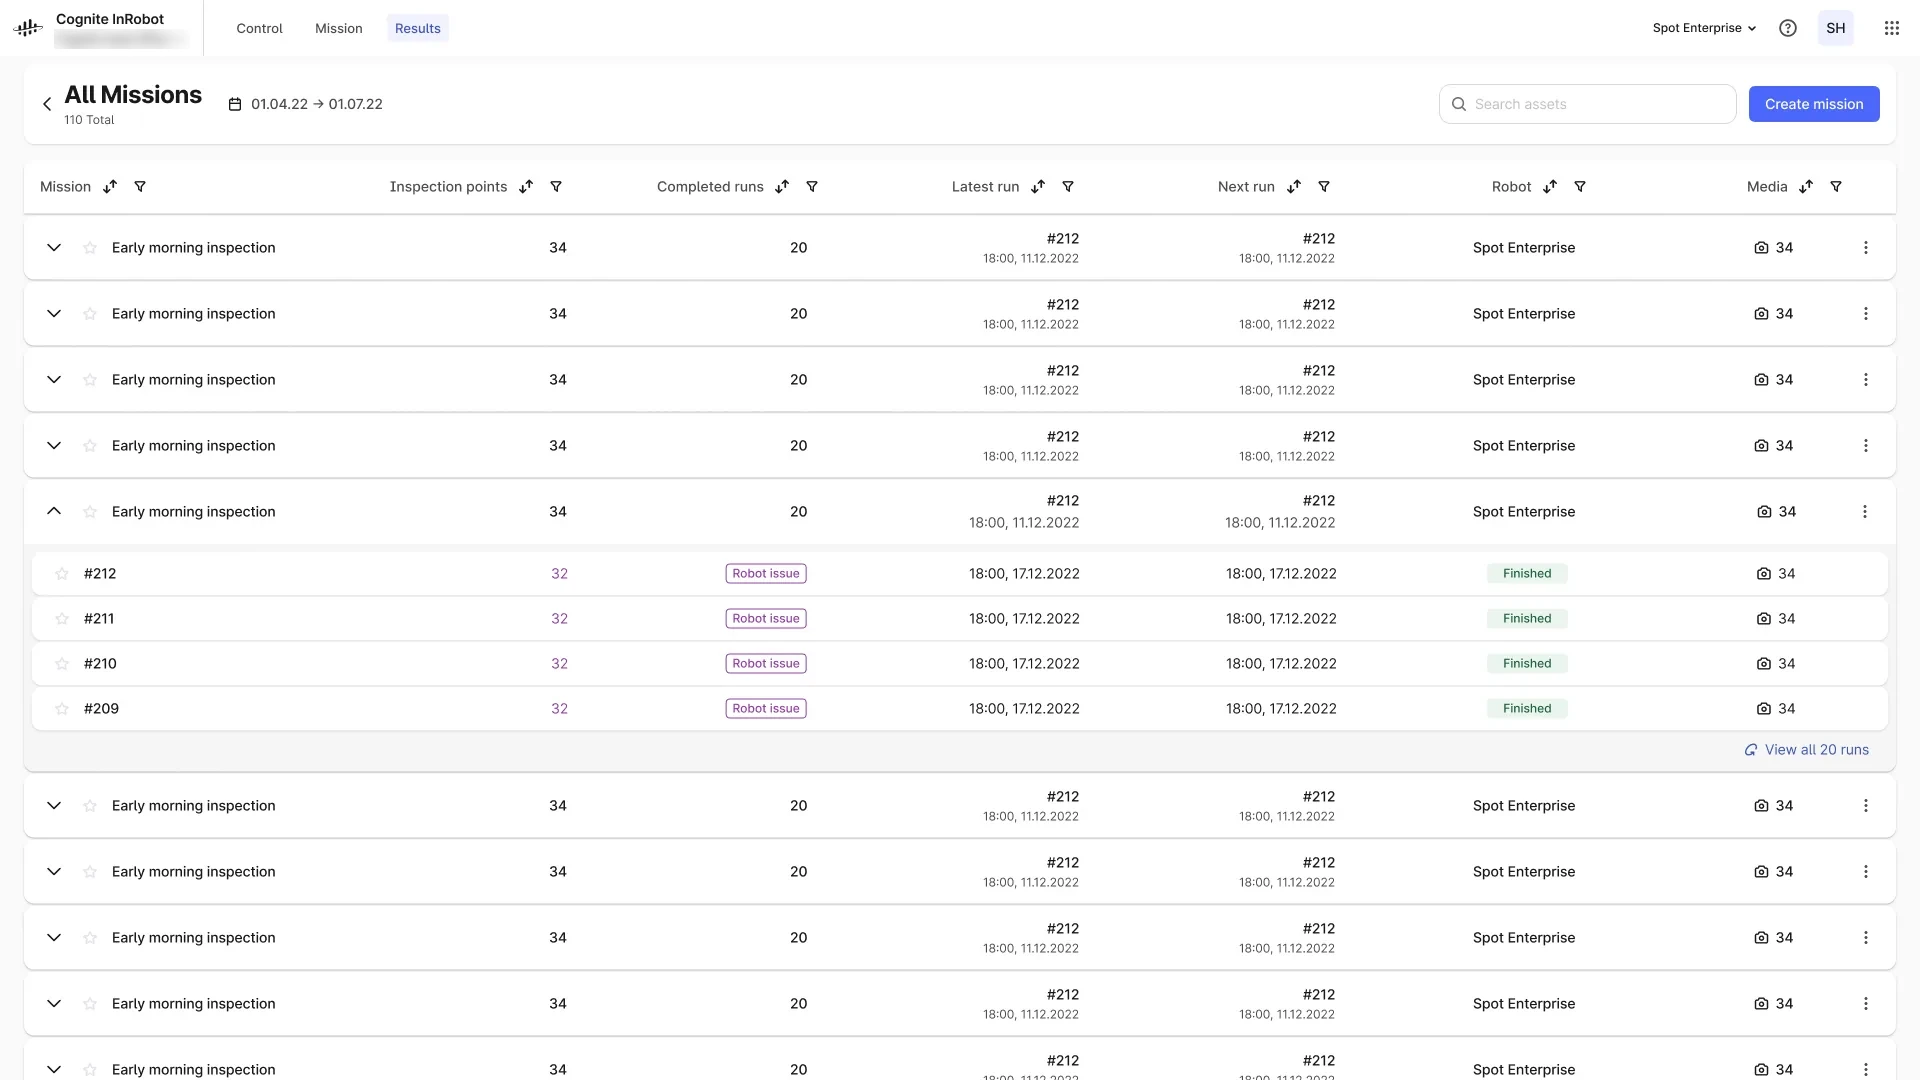
Missions · a mission opens inline to its latest runs.
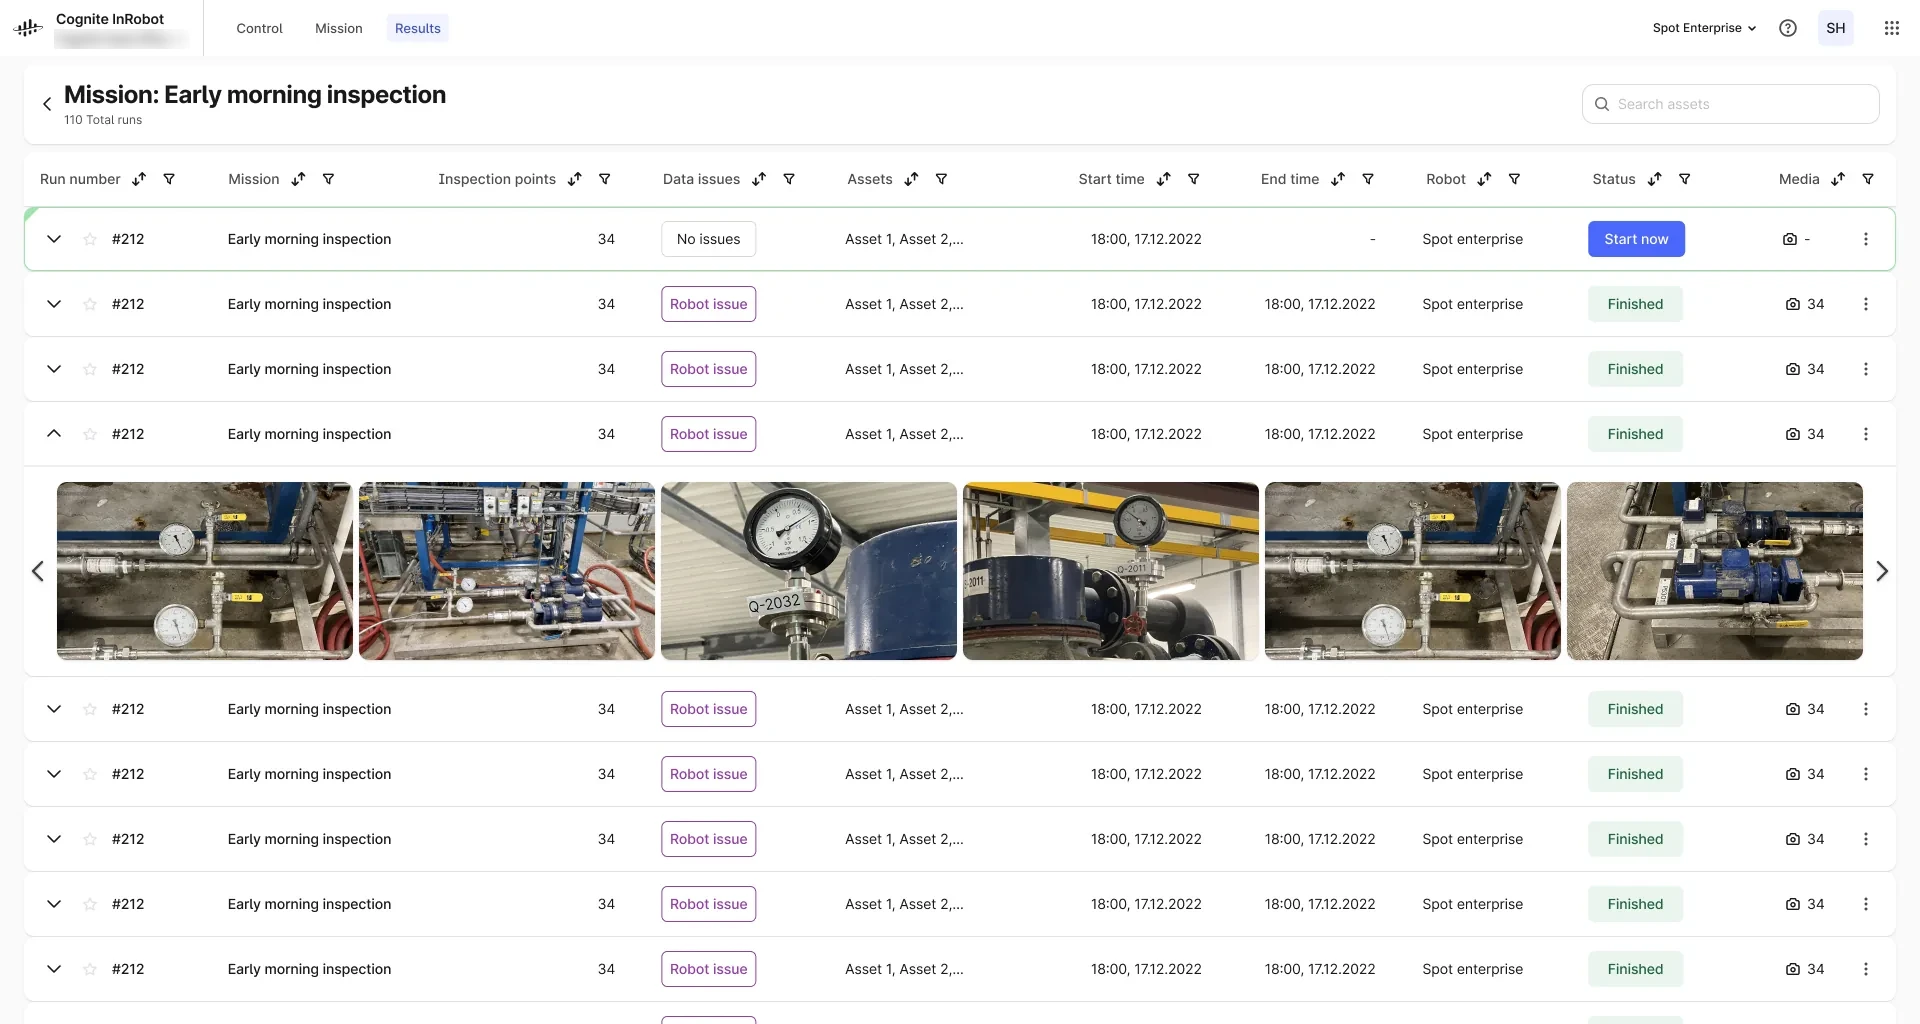
Runs · a run opens inline to its photos.
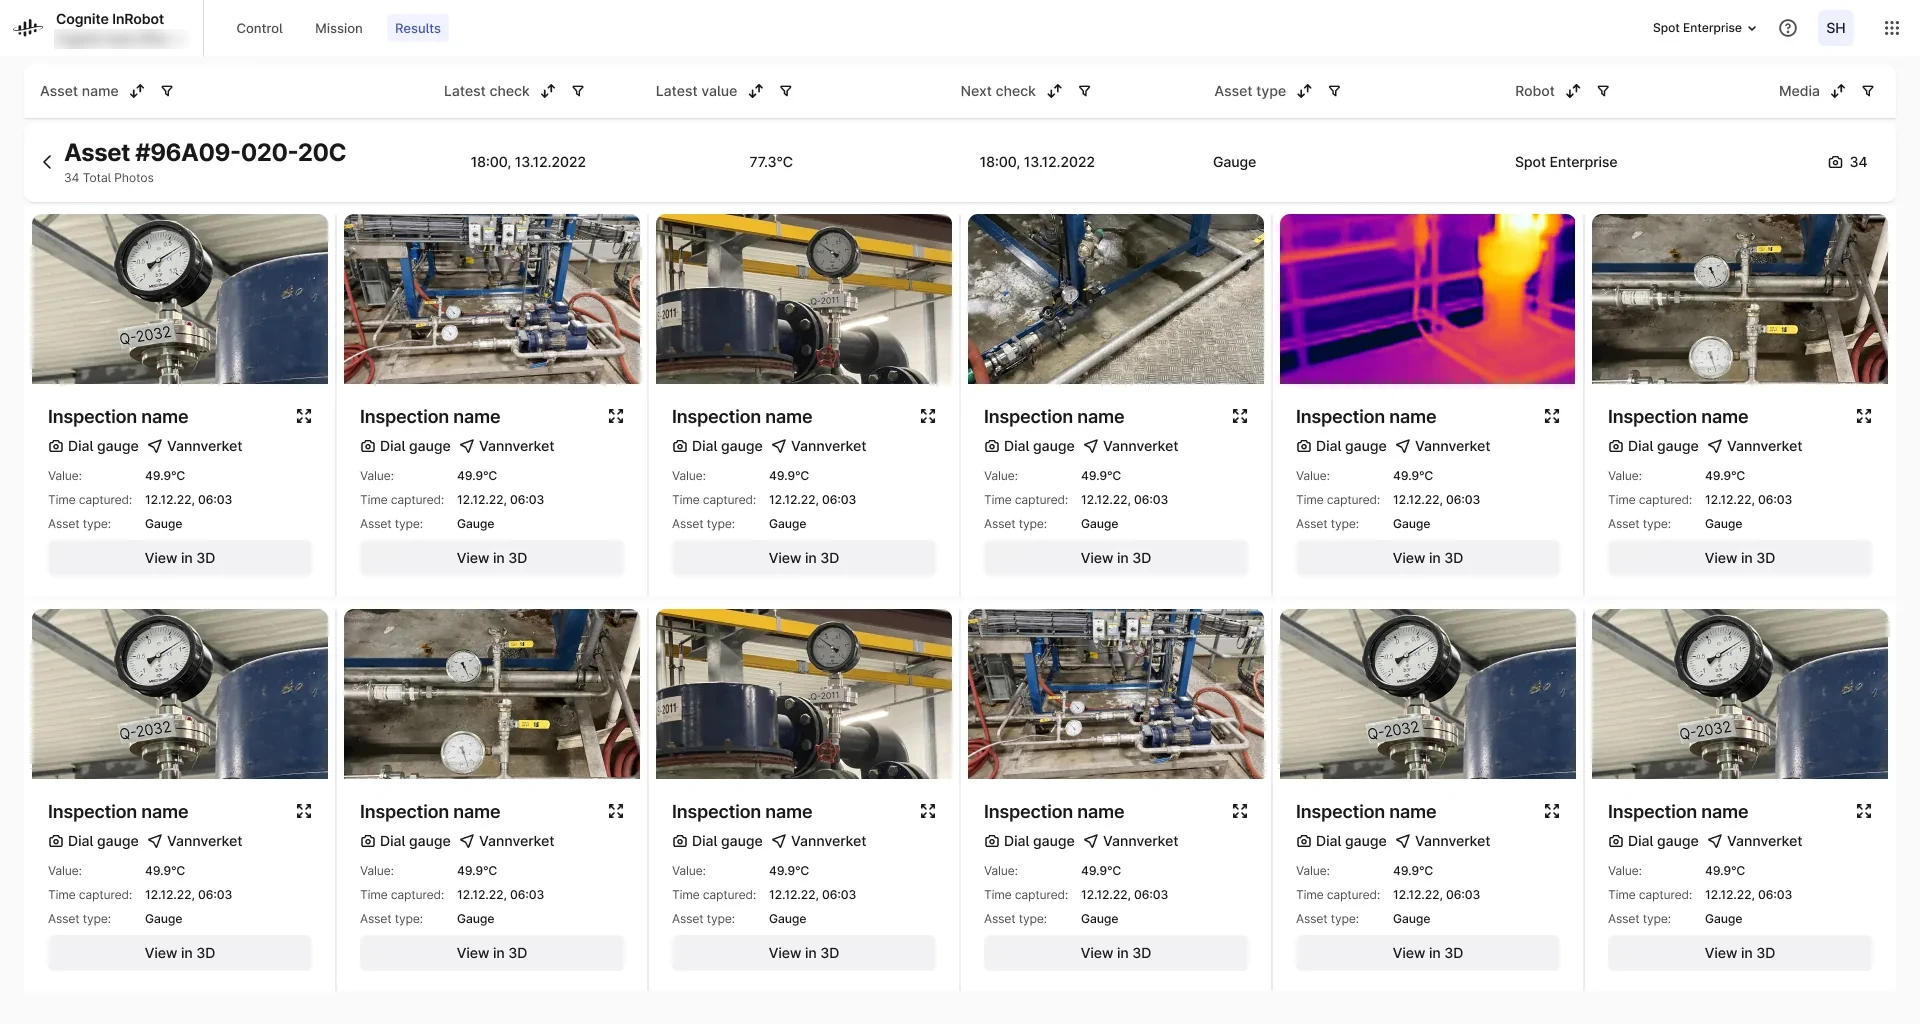
Asset · one asset, every capture the robots took of it.
Point on the map, the robot finds the way.
Alongside Results we explored how a person moves the robot: click a destination on a 3D map and the robot plans the path, or drive it directly.
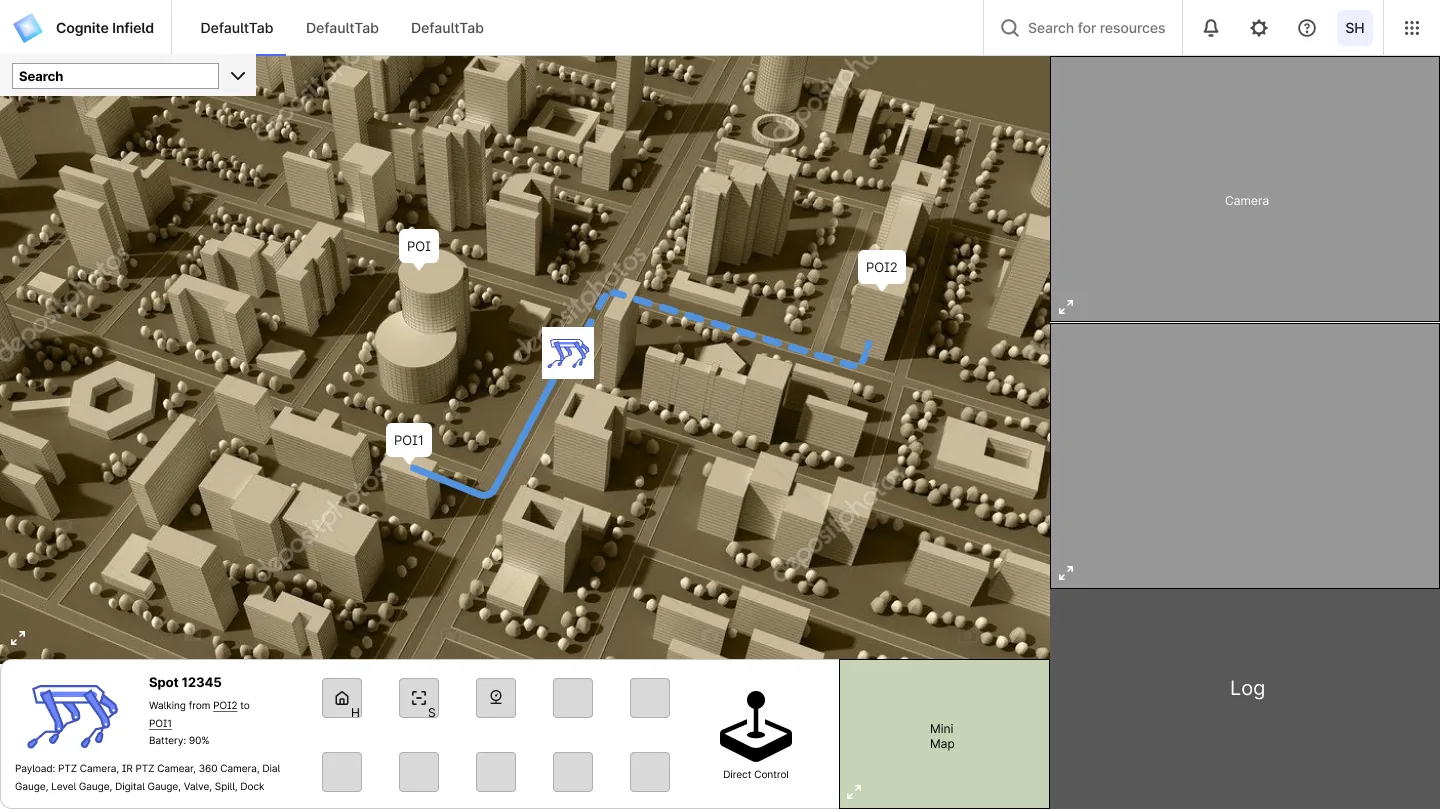
Point-and-click · pick a point on the 3D map; the robot plans the path.
Its own stack, its own small library.
InRobot was built on a different tech stack, so Cogs, Cognite’s design system, did not reach it. Sam and I built a small library in the same spirit, just for what robots need: robot cards, inspection cards, and the run and mission tables.
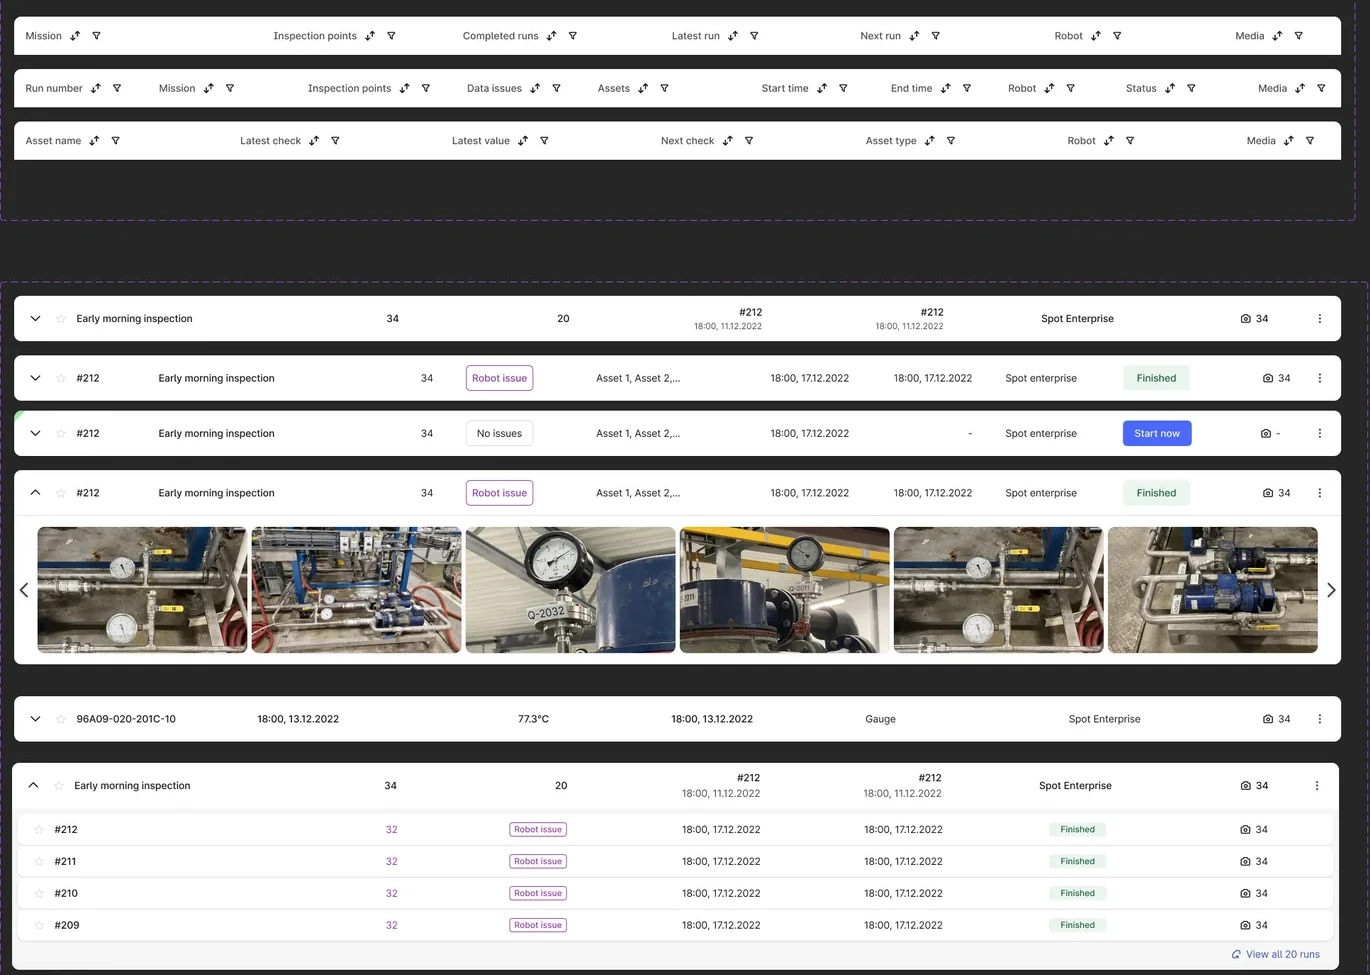
InRobot library · mission, run and asset rows, collapsed and expanded.
Where it landed.
Product
- Results designed as a third area next to Control and Missions
- Mission report: “the main working file for designers”
Team
- Small InRobot library, shared with the team
- 53 heuristic findings across Control and Mission
Key decisions
- Results open in place, not page by page
- Robot issues shown apart from run status